SPECTROMETERS: Master the microspectrometer specification game
GREG NEECE
How many pixels do you need to measure your spectrum? For many spectrometer customers, the typical answer has been, "as many pixels as the manufacturer will sell." However, properly specifying a spectrometer best suited for your specific application can be easier if you know the right factors to consider.
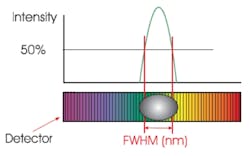
Optical resolution is frequently one of the driving factors in configuring a spectrometer. Sometimes, applications do demand as many pixels as the manufacturer can sell. The pixel number in combination with the slit and grating options will determine the final optical resolution. Often dispersion (wavelength range divided by the number of pixels) is used when discussing resolution. Full-width half-maximum (FWHM), or the width of a peak at half of its maximum intensity, is a better way of determining resolution (see Fig. 1). Using FWHM, the actual optical performance of one spectrometer design can be compared directly to another. This avoids such pitfalls as, for instance, having a grating that does not use all of the available pixels; or, in another case, having an optical design that does not produce a sharp image of the slit onto the detector array. Cross Czerny-Turner designs can exhibit this latter problem due to the sharp angles of reflection and inherent system magnification required.
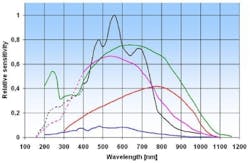
Sensitivity is another factor to consider in specifying your microspectrometer. Sensitivity is completely independent of the number of pixels in linear arrays typically found in today's microspectrometers. The exception to this rule is the use of a two-dimensional array in a vertically binned arrangement or horizontal binning of a linear array. In the case of vertical binning, the vertical line of pixels is used, or in a crude sense added up, to equal one larger pixel. So, when considering the sensitivity requirements of a given application, it is much more important to look at the response curves of the detectors offered (see Fig. 2). If the application is in the visible range of the spectrum, several different brands of charge-coupled devices (CCDs), regardless of the number of pixels, are a good option. However, for applications in the near-infrared (NIR) range where CCD sensitivity declines, a different array with better NIR response, such as indium gallium arsenide (InGaAs) or lead sulfide (PbS), would be a better choice.Signal-to-noise performance may also be a part of the decision matrix. In typical CCDs, higher sensitivity leads to decreasing signal-to-noise performance. To a certain extent, spectra averaging can overcome this. Averaging multiple spectra for a single output increases the signal-to-noise performance by the square root of the number of averages: for example, averaging 100 spectra improves signal to noise by a factor of 10. Still some applications require superior performance with respect to signal to noise. For this, customers should turn to the signal-to-noise performance published for each optical bench and detector combination for a spectrometer platform. It is important to note that the published signal-to-noise performance figures should come from data measured through the entire spectrometer system to ensure it represents the overall system performance. A detector with good signal-to-noise response is not much use when used in a poorly performing system. A good method of comparing signal-to-noise performance of detectors is to calculate the mean and standard deviation per pixel for 100 scans. Signal to noise is then the mean divided by the standard deviation. The manufacturer should perform this calculation with the signal near the saturation limit of the detector with an appropriate smoothing setting (if required).
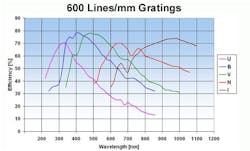
Grating selection can be the trickiest option to specify. Two factors are typically discussed with respect to gratings: wavelength range and optical resolution. Wavelength range can be limited by the detector chosen or the grating or both. Optical resolution is driven by not only the grating but the slit and detector (number of and size of pixels) as well. A third factor to consider is the impact of the grating on system sensitivity. Different gratings will each have their own points in the spectrum where they are most efficient. It is sometimes valuable to look at grating efficiency curves when system optimization is important (see Fig. 3). If you find yourself confused, you are probably not alone, so call the system supplier. Tradeoffs exist here that can lead to dual or multi-detector systems for microspectrometers that are able to support this capability.Luckily, determining the remaining options for your spectrometer is fairly straightforward. For instance, for ultraviolet (UV) performance below 360 nm in wavelength, a coating must be applied to standard CCDs. Other detectors, such as back-thinned CCDs or CMOS detectors do not require this option. To avoid second-order effects, some version of a second-order coated optic or long-pass filter can be included. Other options are application specific, such as non-linearity or irradiance calibrations for radiometric measurement.
An example system
With the basics outlined, a simple and practical example will demonstrate how to put them into practice. Suppose a system is needed to measure fluorescence of a liquid sample in a standard cuvette. What are the considerations with respect to the spectrometer? First of all we should consider both the wavelength range and optical resolution required. Many basic fluorescence measurements have an excitation in the UV range with a response in the visible. If we want to see both the excitation and response, we should choose a broadband instrument covering 200 to 1100 nm. If we want to exclude the excitation and see only the response, we can choose an instrument with a narrower wavelength range, for example, 360 to 1100 nm or 500 to 1100 nm. All of these ranges are available.
Fluorescence response is typically weak and presents a fairly large FWHM (a broad peak). This leads to the choice of a sensitive detector, most likely a CCD array, and a relatively large slit of perhaps 200 µm. The large slit allows more light into the spectrometer but, of course, will reduce system resolution. The resolution impact may be acceptable because fluorescence response is typically broad. The grating selection of either 300 or 600 lines/mm yields an optical resolution of 8 or 4 nm, respectively, in a typical microspectrometer. Likely this is more than sufficient for fluorescence.
Beyond the spectrometer, light sources and sampling options are numerous for fiber-optic systems, but are beyond the scope of this article. Ask the supplier of the instrument for recommendations and explanations. Suppliers should be able to confirm your assumptions and make productive, cost-effective recommendations to help you determine the best configuration of your microspectrometer for your application.
GREG NEECE is president of Avantes North America, 9769 W. 119th Dr., Ste. 4, Broomfield, CO 80021; e-mail: [email protected]; www.avantes.com.


