World events over the last two years have shifted much of the focus in remote sensing to security and defense applications. But advances in remote data-collection technologies and data-processing software are also expanding in environmental applications, especially for land and sea studies.
In oceanography, conventional ship-based instruments are being supplemented with optical sensors and lidar mounted aboard satellites, small aircraft, buoys, and even blimps to study the ebb and flow of the ocean and the impact of natural and man-made forces on ocean environments.
Each approach brings with it a different set of data-collection capabilities, expanding the ability of oceanographers to make ever broader and deeper assessments of the ocean, the atmosphere, and the relationship between the two. Changes in ocean ecosystems are good indicators of global changes in climate and the ozone, so instruments that can track these changes help oceanographers monitor and predict their effects on phytoplankton, algal blooms, coral reefs, shellfish, mammals, and other ocean populations. This same information can also be used to enhance fisheries, map coastlines, and predict the paths of hurricanes.
Flying high
Satellite-based sensors began playing a major role in the collection of ocean data 25 years ago, when the Coastal Zone Color Scanner aboard the satellite Nimbus 7 provided the first space-based measurements of radiance coming out of the ocean utilizing the largest continuous-wave light source at our disposal: the Sun. When sunlight enters a water body it is absorbed, transmitted, and/or reflected, depending on what is in the water. As with more sophisticated types of fluorescence imaging, depending on the amount of energy reflected or emitted in different windows of the electromagnetic spectrum (primarily in the visible to near-infrared), it is possible to distinguish various surface types, temperatures, and concentrations by wavelength.
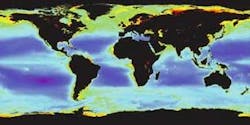
The primary applications for passive optical sensors in marine studies are based on ocean-color data. Ocean color is the wavelength dependence of the water-leaving radiances at the ocean surface and is the result of scattering and absorption by chlorophyll pigments and dissolved and particulate matter in surface ocean water. Remote sensing of ocean color provides information on the abundance of phytoplankton (microscopic marine plants), the concentration of chlorophyll and dissolved and particulate material in surface ocean waters, and sea surface temperature (see Fig. 1).
FIGURE 1. Phytoplankton concentration derived from satellite observation (SeaWiFS) and quantification of ocean color in the visible-light region (400 to 700 nm) varies with the concentration of chlorophyll and other plant pigments in the water. This false-color representation of chlorophyll_a or phytoplankton pigment concentration was calculated from radiance measurements taken from October 1997 to April 2002.
One of the best known passive ocean-color sensing systems in marine studies is SeaWiFs (Sea-viewing Wide Field-of-view Sensor). Launched by NASA in 1997 as a follow-on to the Coastal Zone Color Scanner, the purpose of SeaWiFS is to provide quantitative data on global ocean bio-optical properties, with particular emphasis on changes in ocean color that signify various types and quantities of phytoplankton.
In essence, SeaWiFS is an airborne spectroradiometer, scanning different regions of the light spectrum and providing simultaneous representations of amplitude vs. wavelength of the spectrum. The SeaWiFS sensor includes an optical scanner and an electronics module and operates in eight wavelength regions (402 to 845 nm), sampling a 1600-km swath every 1 km as the satellite circles Earth. Because the orbiting sensor views every square kilometer of cloud-free ocean every 48 hours, the ocean-color data observes the exchange of critical elements and gases between the atmosphere and ocean. This data can then be used to assess the global carbon cycle—NASA's primary interest, according to Chuck McClain, SeaWiFS project scientist at Goddard Space Flight Center (Greenbelt, MD).
"About half of the carbon in our atmosphere is equally partitioned between terrestrial plants and marine plants (phytoplankton)," said McClain. "Marine plants live and die on a very fast cycle and so are fixing carbon on a very fast rate. In fact, marine plants fix as much carbon as the terrestrial biosphere. And with the data sets from these satellites, we can start estimating the carbon uptake of the ocean for the first time."
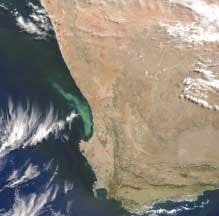
FIGURE 2. An image captured by MODIS satellite sensor shows a cloud of phytoplankton that has been blooming near South Africa's western coast since early April. Reports from water sampling at the site indicate that it is a rather unusual red tide containing a mixture of organisms called dinoflagellates and a species of coccolithophore called syrachosphaera pulchra. High concentrations of the organism appear very bright blue or green.
SeaWiFS will soon be replaced by the next generation of satellite ocean-sensing systems: MODIS (Moderate Resolution Imaging Spectroradiometer). Launched in May 2002, MODIS Aqua collects data on ocean color, phytoplankton, sea surface temperature, and ocean primary production in the 405- to 877-nm range (see Fig. 2). Picking up where SeaWiFS left off, MODIS is able to measure a broader range of photoinduced fluorescence of phytoplankton and collect data on ocean circulation and the carbon cycle.
Optical sensors are not just confined to the air, however. Satlantic (Halifax, Nova Scotia), is using them underwater to help mussel farmers improve the quality and safety of their products. Working with the National Research Council's Institute for Marine Biosciences and Dalhousie University (both Halifax, Nova Scotia), Satlantic's buoy-mounted arrays of silicon detectors measure light absorption at multiple wavelengths to detect plankton and other dissolved and particulate materials in seawater.
The instruments include an irradiance sensor that sits above the water and measures light coming directly from the sun and sky (downwelling irradiance); a radiance sensor below the surface that measures sunlight reflected back up through the water; and a "K-chain" of four irradiance sensors at varying depths that measure the penetration of downwelling irradiance. The first two instruments are hyperspectral sensors that measure 120 wave bands; the third is a chain of multispectral sensors that measure four wave bands: one ultraviolet, two blue, and one green.
Unlike satellite-based systems, which are limited to measurements at specific times each day at the surface of the water when there is no cloud cover, these sensors have the capacity to take measurements both at the surface and under water, at multiple depths, in any weather, during all daylight hours.
Hyperspectral imaging
While satellite-based sensors have played an important role in studying the open ocean, coastal environments pose a number of challenges to these passive systems. Thus, oceanographers are turning to more advanced techniques such as hyperspectral imaging and lidar for turbid water studies.
Hyperspectral imaging offers several advantages when studying coastal environments, which are more complex than the open ocean, given the wider range of optical properties in the water column (a conceptual column from the surface to the bottom sediments) due to runoff from land, high levels of phytoplankton growth, sediment resuspension, and other processes. An additional level of complexity is added when the bottom is visible through the variable water column. Resolving the bottom features as viewed through the optical properties of the water column is the central problem in coastal remote sensing.
But hyperspectral imaging captures far more information than most satellite images. In hyperspectral imaging, data is typically collected using an optoelectrical system that measures reflected solar irradiance. The sensors collect in hundreds of narrow, contiguous wavelengths so that for each pixel in an image, a reflectance spectrum can be derived that is dependent upon the composition and structure of the materials being imaged. Hyperspectral instruments are carried primarily on airplanes and can detect at least 100 unique bandwidths, compared with the 7 to 15 bands detected by most current satellite-borne instruments.
"Early sensors had a very small number of wavebands in the blue, green, and red," said Marlon Lewis, founder and president of Satlantic and one of the developers of SeaWiFS. "As time has gone on, they have become more sophisticated, which means you can chop the spectrum up into smaller and smaller pieces to look at aspects of the reflected spectrum and diagnose what is going on in the ocean."
In a three-week U.S. Navy project earlier this year, hyperspectral imaging was used aboard a blimp to locate and study the behaviors of right whales, an endangered species. Working along the coast of Florida, Science & Technology International (STI; St. Augustine, FL) used its 200-ft-long airship outfitted with its Littoral Airborne Sensor Hyperspectral (LASH) system (each sensor is a spectrometer with a variable bandwidth of 390 to 840 nm) and a Wescam (Burlington, Ontario) MX-20 electro-optic camera to conduct the whale searches.
According to Don Statter, deputy program manager and lead for sensors and processors for the Navy's Airship Whale Search Network (www.lashwhalesearch.org), the LASH sensor was able to detect whales at least 50 ft underwater, and the Wescam sensor could detect whales at the surface many miles away. Using standard aircraft and shoreline counts, right whales are typically detected only about 30% of the time at the surface.
"The airship is a stable and quiet platform, giving us the ability to truly track a whale's behavior and migration patterns," explained Randy Carter, STI's Flight Operations Manager. "The noise of an airplane usually modifies the whale's behavior."
Laser radar
Laser-based lidar (light detection and ranging) has also proven to be an important tool for oceanographers. While satellite pictures of the ocean surface provide insight into overall ocean health and hyperspectral imaging provides more insight, lidar is able to penetrate beneath the surface and obtain more specific data, even in murky coastal waters. In addition, lidar is not limited to cloudless skies or daylight hours.
"One of the difficulties of passive satellite-based systems is that there is water-surface reflectance, water-column influence, water chemistry, and also the influence of the bottom," said Chuck Bostater, director of the remote sensing lab at Florida Tech University (Melbourne, FL). "In shallow waters we want to know the quality of the water and remotely sense the water column without having the signal contaminated by the water column or the bottom."
A typical lidar system comprises a laser transmitter, receiver telescope, photodetectors, and range-resolving detection electronics. In coastal lidar studies, a 532-nm laser is typically used because it is well absorbed by the constituents in the water and so penetrates deeper in turbid or dirty water (400 to 490 nm penetrates deepest in clear ocean water). The laser transmits a short pulse of light in a specific direction. The light interacts with molecules in the air, and the molecules send a small fraction of the light back to the telescope, where it is measured by the photodetectors.
Lidar has been used for nearly 30 years by NASA and other agencies to map the principle optical constituents in the ocean and validate satellite retrieval of the same products. Frank Hoge's group at Goddard, for example, has underflown SeaWiFS with the Airborne Oceanographic Lidar (AOL) system designed by C. Wayne Wright, a scientist at Goddard's observational science branch. The AOL fluorospectrometer features a laser transmitter that emits both doubled and tripled Nd:YAG laser wavelengths (532 and 355 nm) to obtain the phytoplankton absorption coefficient, which can then be compared to SeaWiFS data for the same day, time, and location. The results have been so good, said Hoge, that it eliminates the need for other validation.
The latest version of the AOL, the AOL3, weighs only 200 lb and can be carried on a small two-engine plane. Like its predecessors, the AOL3 transmits two laser wavelengths, 355 and 532 nm, which interact with the water molecules, causing a Raman shift that allows normalization of other light measurements to compensate for changes in water clarity. If biological organisms containing chlorophyll and/or phycoerythrin are present in the water, the 532-nm energy is absorbed and re-emitted as particular bands of fluorescence. The 355-nm laser radiation causes fluorescence of some chromophoric dissolved organic material (CDOM)—one of the most important inherent optical properties in the ocean because it is one of the few constituents that behaves nearly the same way every day, according to Hoge.
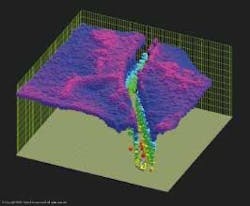
FIGURE 3. SHOALS-1000 airborne lidar bathymetry system uses laser pulses to determine water depths up to 50 m. For this 3-D-point representation of a survey scene, the SHOALS-1000 received returns from a subsurface coral reef less than 0.5 m deep.
On the commercial front, OpTech (Toronto, Ontario) has launched its fourth-generation airborne lidar bathymetric survey system, the SHOALS-1000, which has found a healthy market in near-shore mapping (see Fig. 3). Using a frequency-doubled Nd:YAG laser operating at 1000 Hz, the lidar bathymeter fires co-aligned laser pulses at the water: the red wavelength is reflected by the water surface and detected by the receiver, while the blue-green wavelength penetrates the water surface and is reflected from the bottom. The time difference between the two signals, after accounting for a range of system and environmental factors, determines the water depth. Using this method, SHOALS can map shallow waters, shoreline, and ground elevations simultaneously, integrating land and water measurements in the same data set. The system can penetrate up to 50 m and cover 100 km2 of shallow water in just three hours, making it much more time- and cost-effective than conventional tools such as near-shore echosound.
"All around the world, governments are interested in exclusive economic zones, which are very tied into coastlines," said Phil Arsenault, vice president of business development for OpTech, which claims the U.S. Coast Guard, DARPA, Japan Coast Guard, U.S. Army Corps of Engineers, and Royal Swedish Navy among its customers. "And lidar answers the problem for coastal survey."


