INTERFEROMETRY: White-light interferometer automatically cancels dispersion
KEVIN RESCH, PRABAKAR PUVANATHASAN, KOSTADINKA BIZHEVA, JEFF LUNDEEN, AND MORGAN MITCHELL
Material dispersion is a major issue for low-coherence (white-light) interferometry, and optical-coherence tomography (OCT).1 The fundamental resolution in these techniques is determined by the coherence length of the light used; submicron resolution has been demonstrated through the use of very broadband light sources.2 However, increasing the spectral bandwidth also increases the deleterious effects of material dispersion on the measured interferogram, such as the broadening and reshaping of the interference peaks, and a reduction in contrast. Without compensation, dispersion rapidly becomes the practical limitation to resolution.
An ideal white-light interferometer would measure optical delays with no loss in resolution from dispersion. This ideal can nearly be achieved in the so-called Hong-Ou-Mandel interferometer (an interferometer based on nonclassical photon pairs).3 When used with frequency-entangled photons, this interferometer can directly measure optical delays while automatically canceling all even-order dispersion, including the dominant quadratic component.4 This effect is known as quantum dispersion cancellation and has been used as the basis for quantum-optical-coherence tomography.5 Other methods not involving quantum entanglement have been proposed or used for compensating dispersive effects, including using numerical transforms, making assumptions about the material properties, using broadband phase conjugation, or adding extra dispersive material to the interferometer.
Completely classical dispersion cancellation
We have recently demonstrated an interferometric technique that achieves the same automatic dispersion cancellation as the quantum interferometer in a completely classical system.6 Our technique significantly reduces the experimental complexity for dispersion cancellation and addresses more fundamental questions concerning the differences between classical and quantum interferometry.
When light of frequency ω passes through a material of length L, it accumulates a frequency-dependent phase shift, f(ω) = k(ω)L, where k(ω) is the wavevector in the material. One can Taylor expand the wavevector about some frequency, ω0. The first-order, or first-derivative, term is responsible for optical group delays and is typically of most interest. The second-order term is the most significant cause of broadening in white-light interferometry. The even orders in the Taylor expansion are referred to as even-order dispersion terms.
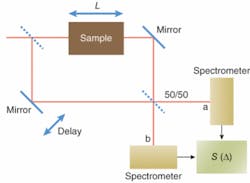
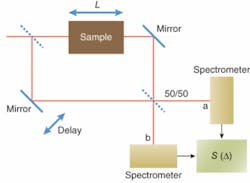
Conceptually, our technique is based on a two-path (Mach-Zehnder) interferometer with a spectrometer in each output, instead of a standard square-law (photodiode) detector (see Fig. 1). The spectrometers record the intensity as a function of frequency ω in output a(b)-or Ia,(b)(ω,Δ) )-for each delay position, δ. While any broad-bandwidth light source could serve in principle, we used a broadband pulsed laser in our experiment.
Quantum dispersion cancellation uses energy-time entangled photons that exhibit strong anticorrelations in energy (or frequency) and strong correlations in time. While classical physics does not allow entanglement, it does permit strong, even perfect, frequency anticorrelations. We define a correlation function, S, by multiplying intensities measured at each output at anticorrelated frequencies:
S(Δ) = ∫dδωI(ω0 + δω,Δ) )I(ω0 - δω,Δ)
The correlation function is easy to calculate from our spectral data at each delay position and requires no a priori assumptions about the properties of the material under study. We have shown that this correlation function is expected to exhibit two prominent features: a rapidly oscillating component, and a relatively slow dip (analogous to the quantum Hong-Ou-Mandel interference, but with 50% of the interference visibility). The rapidly oscillating component is affected by dispersion. However, the dip, while shifted by the group delay, is completely unaffected by even-order dispersion. It is straightforward to distinguish between the rapid oscillations and the slower dip because of the significant separation in their respective length scales.
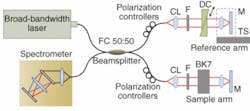
In our experimental setup, a fiber-based Michelson interferometer was pumped by an ultrafast fiber-coupled laser (center wavelength of 792 nm, full-width at half-maximum bandwidth of 154 nm; see Fig. 2). The optical delay between the sample and reference arms was controlled by a motorized translation stage in the reference arm. A high-resolution spectrometer recorded the resulting spectral interference patterns at each delay position. Two glass prisms in the reference arm were adjusted to balance dispersion before the introduction of any additional dispersive material. It is important to note that compensation was done only once in order to allow for direct comparison of the system performance with and without additional dispersion.
Measurements were made in a dispersion-balanced system, as well as after the introduction of uncoated BK7 optical flats into the sample arm. For each measurement, the reference mirror was translated in steps of 0.1 µm and the spectral interference fringes were acquired with a read-out time of 60 µs per step. These spectral interference fringes were then used to calculate the correlation function. Our specific method accounts for an asymmetric spectrum and the nonlinear relation between spectrometer pixel number and frequency.6 Note, however, that we can calculate S using just a single spectrometer because the source spectrum I(ω) can be independently measured, is independent of delay δ, and we have the relation I(ω) = I(ω,Δ) + I(ω,Δ).
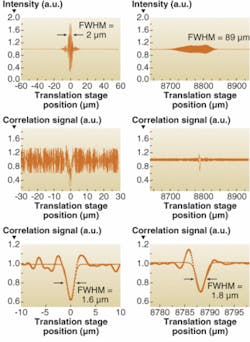
We compare the standard white-light interference pattern-that is, the total intensity registered by the spectrometer-to our correlation function in the dispersion-compensated case and after the introduction of 16.8 mm of BK7 glass in the sample arm, through which the light passes twice (see Fig. 3).
As a result of the additional material dispersion, the standard white-light interference pattern is significantly broadened, from 2 µm in the compensated case (Fig. 3, top left) to 89 µm with the presence of the additional glass (Fig. 3, top right). The fringe visibility is correspondingly reduced from 78% to 14%. These data clearly show the detrimental effects of dispersion on interference resolution and contrast.
Compare this performance with that of our correlation function in the compensated case (Fig. 3, center left) and with the additional glass (Fig. 3, center right). Each signal exhibits a sharp dip and a rapidly oscillating component, as expected. Interestingly, the magnitude of the unwanted fast oscillation is actually reduced by the large amount of dispersion. The fast oscillations in the data from Fig. 3, center, were removed using a low-pass Fourier filter; the resulting data are shown in Figs. 3, bottom left and right. These dips were fitted to Gaussian functions to extract their centers and widths. While the standard interference pattern is broadened by 4250% of its original size due to material dispersion, our correlation signal is broadened by only 14%. The visibility of the dip also shows remarkable resilience to dispersion, dropping only from 41% to 30% for Figs. 3, bottom left and right, respectively. (In comparison, the theoretical maximum visibility is 50%.)
High signal-to-noise for OCT
Our new technique, like the quantum technique upon which it is based, uses broadband light to achieve narrow interference features and narrow correlations to eliminate even-order dispersive broadening. Although our technique gives only half the interference contrast of the quantum interferometer, it allows for orders-of-magnitude faster data accumulation owing to the difference in optical intensities between entangled-photon sources and lasers. Dispersion-cancellation interferometry is particularly promising for OCT because it facilitates high axial resolution and a high signal-to-noise ratio along the entire imaging depth.
ACKNOWLEDGMENTS
The authors would like to thank Aephraim Steinberg, Jonathan Lavoie, Devon Biggerstaff, Rainer Kaltenbaek, and Grant Salton for valuable discussions and Gregor Weihs for laboratory equipment. We gratefully acknowledge the financial support of the University of Waterloo, NSERC, and ORDCF.
REFERENCES
1. J.G. Fujimoto et al., Nat. Med.1, 970 (1995).
2. W. Drexler, J. Biomed. Opt.9, 47 (2004).
3. C.K. Hong et al., Phys. Rev. Lett. 59, 2044 (1987).
4. A.M. Steinberg et al., Phys. Rev. Lett. 68, 2421 (1992).
5. A.F. Abouraddy et al., Phys. Rev. A65, 053817 (2002).
6. K.J. Resch et al., Opt. Express15, 8797 (2007).
Tell us what you think about this article. Send an e-mail to [email protected].
KEVIN RESCH, PRABAKAR PUVANATHASAN, and KOSTADINKA BIZHEVA are at the University of Waterloo, Waterloo, ON, Canada N2L 3G1; e-mail: [email protected]. JEFF LUNDEEN is at the University of Oxford, Parks Rd, Oxford, England OX1 3PU. MORGAN MITCHELL is at the Institut de Ciencies Fotoniques, Mediterranean Technology Park, 08860, Castelldefels (Barcelona), Spain.


