THIN-FILM METROLOGY: Ellipsometry provides detailed analysis of infrared optical thin films
THOMAS E. TIWALD, RON SYNOWICKI, and WILL LOHNEISS
As the number of applications for infrared optics grows, so does the need for accurate measurement of the infrared (IR) optical properties of the materials that are used to fabricate lenses, mirrors, and other optical components. Modern IR-spectroscopic ellipsometry (SE) instruments and associated data analysis software can provide highly accurate and repeatable thickness and optical property measurements of substrates, as well as single and multilayer film samples, over the spectral range from 1.7 to 33 μm (300–5000 cm-1).
Ellipsometry measures changes in the polarization state of light via reflection or transmission as the light interacts with the sample. Traditionally, the change in polarization is described using the complex ellipsometric equation
tan(ψ)eiΔ = řp /řs (ṫp / ṫs for transmission),
where řp, řs, ṫp, and ṫs are the complex Fresnel coefficients of the sample. Sophisticated IR ellipsometers can also acquire other types of data including depolarization, generalized ellipsometry for non-depolarizing anisotropic materials, and Mueller matrix ellipsometry for depolarizing anisotropic materials, as well as polarized transmittance and reflectance intensity data.1, 2
Most mid-IR spectroscopic ellipsometers use a Fourier transform (FT) IR spectrometer as a light source; wire-grid polarizers made of zinc selenide (ZnSe), KRS-5, and other IR-transparent materials; paraboloidal mirrors for focusing and collimation; and an appropriate detector. Many instruments also include a phase retarder or "compensator." All IR-SE instruments are distinguished from their UV-visible-NIR counterparts by the large non-idealities of polarizers and other optical elements. With careful selection of optical components and system calibration, IR-SE instruments can deliver accuracy and precision similar to that of UV-visible ellipsometers.
The IR-SE data (and polarized reflectance data) described in the examples given here were all acquired using a commercially available rotating-compensator ellipsometer (RCE) with a wavelength range of 1.7 to 30 μm. A key feature of an RCE instrument is that Δ (the p–s phase difference) remains accurate for all possible values (0º to 360º). This translates into accurate k(λ) (dielectric function) values even when the films and substrates are transparent, which often is the case at mid-IR wavelengths.
| Δ for a 10.6 μm reflective quarter-wave plate for five different measurements* | |||||||
| Wavelength (μm) | Date & order of measurement | Average | Standard deviation | ||||
| Aug-17 | Aug-31, 1st | Aug-31, 2nd | Aug-31, 3rd | Aug-31, 4th | |||
| 10.538 | 269.65 | 269.67 | 269.69 | 269.68 | 269.68 | 269.67 | 0.02 |
| 10.6 | 268.84 | 268.86 | 268.88 | 268.87 | 268.87 | 268.86 | 0.02 |
| 10.625 | 268.52 | 268.54 | 268.56 | 268.55 | 268.54 | 268.54 | 0.01 |
| *The retarder was remounted and realigned before each measurement. 10.6 μm Δ values interpolated from nearest measured wavelengths (also shown). | |||||||
Data analysis usually consists of fitting data generated from an optical model to the experimental ψ-Δ spectra by optimizing model parameters. The model consists of one or more layers, each with specified thickness and optical function (n(λ) and k(λ)). The thickness and optical functions are optimized to achieve the best fit to data, as represented by a minimum in χ2 or other mean squared error (MSE) functions. The ellipsometric software allows for sophisticated analyses of almost any film and/or substrate combination. These include single or multilayer structures; materials that are transparent or opaque, isotropic or anisotropic; samples with graded-index layers or nonuniform thicknesses; and so forth.
The optical properties of a material depend on whether it is in bulk or thin-film forms. These properties also depend on the microstructural properties of the material, which can be monocrystalline, polycrystalline, or amorphous. Crystallites can have different sizes, phases, and orientations and can be mixed with amorphous material. Amorphous materials may have different short-range order. All materials may contain trace amounts of elements such as hydrogen that can radically alter n(λ) and k(λ). All of these properties may also depend on deposition and processing conditions.
Following are some examples of ellipsometric analyses. Infrared-SE analysis determined the thickness and optical properties of various thin-films and substrates from a single measurement. The analyses include examples of a single and multilayer film, as well as a bulk anisotropic substrate. There is also an example of the direct measurement of retardance for a CO2 laser mirror.
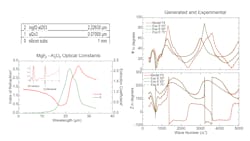
MgF2-Al2O3 on siliconThis analysis was part of a larger study of wide-angle IR antireflection multilayer coatings.3 Ellipsometric analysis determined the thicknesses and mid-IR optical functions, n(λ) and k(λ), of ZnS (zinc sulfide), Al2O3 (alumina), MgF2-Al2O3 (magnesium fluoride-alumina) GeO2 (germanium dioxide), and SiO2 (silicon dioxide) films on silicon substrates. The optical model used for analysis consisted of a silicon substrate with a ~70 nm Al2O3 adhesion layer, topped with a ~2.2 mm layer consisting of MgF2 mixed with a small amount of Al2O3 (for mechanical stability). The optical properties of the silicon substrate and Al2O3 adhesion layer were previously determined and were not allowed to vary during analysis (see Fig. 1a). The film thicknesses and n(λ) and k(λ) of the MgF2-Al2O3 layer were determined by fitting the model to the data.
Additionally, chemical information about a film can often be extracted from the analysis including the presence of impurities and other substances incorporated into a film during or after deposition. In this example, the O-H stretch absorption peak centered at 3 μm combined with the O-H-O scissor vibration peak at about 6 μm indicate that water has been incorporated into the MgF2-Al2O3 layer either during or after deposition (see Fig. 1c, inset).
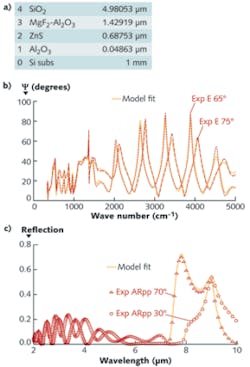
SiO2/MgF2-Al2O3/ZnS/Al2O3 multilayer on siliconThe entire antireflection multilayer stack was also measured during the same study. In this case, only layer thicknesses were varied during the data fit–the optical constants of each layer were fixed at values previously determined from single-layer samples (including the MgF2-Al2O3 discussed earlier). Figure 2 shows the final thicknesses and fit. Simulated reflectance data generated from the same model provide a good match to the experimental IR-reflectance data, which were measured using the same ellipsometer (see Fig. 2c). This highlights how accurate ellipsometric analysis can predict optical performance, and the measurement of angle-resolved polarized reflectance demonstrates the versatility of the instrument.This is an example of generalized-spectroscopic ellipsometry (g-SE), where the off-diagonal ellipsometric quantities Asp = tan(ψ)eiΔps = řps /řpp, and Asp = tan(ψsp)eiΔps = řsp /řss are measured along with the diagonal quantity AnE = tan(ψ)eiΔ = řpp /řss.
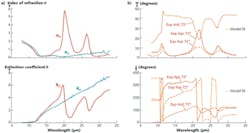
The fact that the off-diagonal quantities Aps and Asp are non-zero means that sample's optic axis is neither parallel nor perpendicular to the instrument's plane of incidence. This type of measurement allows for the simultaneous determination of the ordinary and extraordinary optical functions as well as the exact optic axis orientation from a single measurement. A number of other anisotropic substrates have been characterized using a similar methodology.
Direct measurement of 9.4 and 10.6 mm quarter-wave reflective retarders
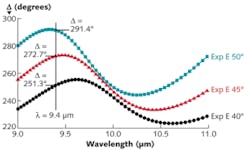
The Δ parameter measured by the IR-SE is a direct measurement of the phase-difference between the p- and s-polarization fields in reflection or transmission–a direct measurement of the quality of quarter-wave and half-wave IR retarders. Note that this is one case where no optical modeling is required. The Δ data from a 9.4 μm quarter-wave reflective retarder at incidence angles of 40º, 45º, and 50º are shown in Fig. 4. The observation of Δ as function of wavelength and angle can aid in optimizing device performance. The table lists Δ for a 10.4 μm quarter-wave retarder measured five different times–the last four measurements occurred twelve days after the first. The retarder was remounted and realigned prior to each measurement. The standard deviation between the five measurements is ±0.02º.REFERENCES
1. M. Schubert, "Theory and Application of Generalized Ellipsometry," in Handbook of Ellipsometry, H.G. Tompkins and E.A. Irene, eds., pp. 637–712, William Andrew, Norwich, NY (2005).
2. H. Fujiwara, Spectroscopic Ellipsometry: Principles and Applications, (English Edition), pp. 111–113, John Wiley and Sons, Chichester England (2007).
3. J.A. Dobrowolski, Y. Guo, T. Tiwald, P. Ma, and D. Poitras, "Toward perfect antireflection coatings. 3. Experimental results obtained with the use of Reststrahlen materials," Appl. Opt. 45, 1555 (2006).


