ULTRAFAST PULSE CHARACTERIZATION: Optical complexity challenges pulse-measurement methods
RICK TREBINO
The processes that generate ultrashort laser pulses require that they have very simple temporal intensities and phases, which is fortunate because most applications work best with simple pulse shapes. As a result, ultrashort pulses emitted by lasers usually have near-unity time-bandwidth product (TBP), the measure of the complexity of a pulse and the approximate number of peaks in the pulse intensity vs. time (or spectrum vs. wavelength).
Some pulses, though—pulses of great interest and utility—are much more complex. Pulses deliberately shaped with TBPs as large as ~20, for instance, can be used to control chemical reactions, thereby generating reaction products other than those intended by nature.1 Potentially much more complex and perhaps also more interesting is the ultrabroadband continuum, which can have a TBP in excess of 1000. Continua have many applications, from optical coherence tomography to simulation of the hydrodynamic rogue waves that have sunk ships on the world’s oceans for millennia and continue to do so at an alarming rate even today.2 And in the new field of arbitrary-optical-waveform generation, the goal is specifically to generate and control the most complex optical waveforms possible.3 Arbitrary waveforms with TBPs approaching 100,000 have been generated.
How do we know what such pulses look like? Unfortunately, the techniques available for measuring simple laser pulses were not designed for this much more difficult task, so most fail at it—indeed, some of them yield a simple pulse even when presented with a complex one! Recent research, though, has yielded new approaches—and some old ones—that can measure pulses with TBPs approaching 100,000. Remarkably, unlike the pulses they measure, these techniques are relatively simple.
Shaped pulses
A now two-decade-old method for measurement of simple pulses directly from lasers can actually measure most pulse shapes. The frequency-resolved optical gating (FROG) technique generates a spectrogram of the pulse by measuring its spectrally resolved autocorrelation. A two-dimensional phase-retrieval algorithm retrieves the pulse intensity and phase from the measured spectrogram.4
The FROG technique measures shaped pulses well, and it even measures pulses whose polarization is also shaped, by making three FROG spectrograms, one each for the vertical, horizontal, and 45° polarizations.5 The advantages of FROG include considerable redundancy in the measured two-dimensional trace, which not only reduces noise in the measurement but also helps confirm its validity—an important feature when measuring such exotic waveforms.
The FROG technique is self-referenced—that is, the pulse is used to measure itself. This is important for measuring pulses directly from lasers when a reference pulse is not available. But when a previously measured simple reference pulse is available, it is usually better to use it, especially when characterizing more complex pulses. Fortunately, such complex pulses are typically produced from the simple pulse emitted by a laser, which can then act as the reference pulse.
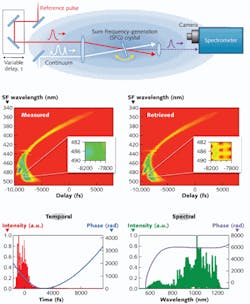
Consider an ultrabroadband continuum, which is typically generated by propagating a simple pulse through optical fiber with nonlinear optical properties (particularly self-phase modulation) that cause massive spectral broadening. The result is light pulses with spectral widths as large as 1200 nm and TBPs up to several thousand. The only technique to have successfully measured continua is a variation of FROG—spectrally resolved cross-correlation (XFROG)—which, in this case, involves spectrally resolving a cross-correlation between the continuum and a replica of the simple pulse that produces it (see Fig. 1).6 Because the simple pulse has so much less bandwidth than the continuum, this simplifies the measurement and works well even though the simple pulse can be much longer than the fine temporal structure in the continuum. In addition, XFROG places no requirement on the spectrum of the reference pulse, so that it can measure pulses as broadband and as complex as a continuum with minimal complications (see Fig. 1).
Spectral interferometry
For characterizing even more complex pulses, the otherwise advantageous two-dimensional redundant nature of the FROG and XFROG traces becomes a liability and must be sacrificed because precious camera pixels must be devoted to measuring the additional pulse complexity. In this case an even older technique, spectral interferometry (SI)—developed in the 1970s—becomes the basis of some new characterization approaches.7
Spectral interferometry requires a previously measured reference pulse whose spectrum contains that of the unknown pulse. SI involves simply measuring the spectrum of the sum of the known and unknown pulses, from which the unknown pulse can be retrieved. Since there is no redundancy in this measurement, it seems at first glance ideal for measuring complex pulses.Unfortunately, SI can be as complex to perform as it is simple to describe. In its standard form SI requires mode-matching and aligning the two beams perfectly collinearly, which is very difficult. Consequently spectral interferometers require constant re-alignment. Worse, SI’s requirement that the two pulses be separated in time so as to yield spectral fringes for its pulse-retrieval algorithm sacrifices most of the spectrometer’s resolution and limits the technique to relatively simple pulses. So at second glance, SI is not ideal for measuring complex pulses.
But an experimentally simpler version of SI has been developed that addresses these problems. Named “spatially encoded arrangement for temporal analysis by dispersing a pair of light e-fields” or SEA TADPOLE, it uses optical fibers to couple in the laser beams and crosses the two beams at an angle after they emerge from the fibers, yielding a much simpler alignment while generating spatial fringes instead of spectral ones.8 This allows the known and unknown pulses to be coincident in time, thereby recovering the spectrometer’s resolution and allowing complex-pulse measurement. As a result, SEA TADPOLE has measured shaped pulses with TBPs as large as ~100 and can in principle measure TBPs as large as ~1000. But how can it be extended to even more complex pulses?
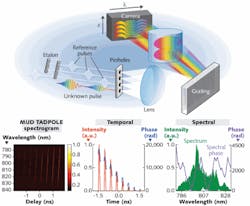
To measure more complex pulses, we can take advantage of an additional advantage of SEA TADPOLE. Unlike standard SI, its reference pulse only measures the part of the unknown pulse with which it overlaps temporally at the output of the spectrometer (by the uncertainty principle applied to each spectrometer resolution element, the reference pulse expands inside the spectrometer to a length of the reciprocal of the spectrometer resolution). So, to measure more complex pulses, multiple delayed replicas of the reference pulse can be used—in MUltiple Delay (MUD) TADPOLE, each reference pulse measures a different temporal region of the unknown pulse (see Fig. 2).9
There are several versions of MUD TADPOLE. In single-shot MUD TADPOLE, the multiple reference pulses (or better, a highly tilted reference pulse) overlap at different angles with the unknown pulse and so generate different spatial-fringe periodicities, allowing them to be separated in the pulse-retrieval algorithm.10 In this way a single very complex pulse can be measured. In multishot MUD TADPOLE, scanning a delay stage allows each temporal region of an even more complex pulse to be measured, assuming the unknown pulse takes the form of a train of identical pulses.
Single-shot MUD TADPOLE has measured a pulse with a TBP as large as ~1000 and multishot MUD TADPOLE has measured a pulse with a TBP of 65,000 (see Fig. 2), very close to the goal of one version of arbitrary-waveform generation, in which a Ti:sapphire laser whose ~100 fs pulses are separated by about 10 ns and are manipulated to be so complex that they stretch from one pulse to the next and so are 10 ns long with a TBP of 100,000 (see Fig. 2).One could also perform SI using an echelle spectrometer, which uses both coarse and fine gratings, whose dispersion planes are arranged perpendicular to each other, yielding a raster-scanned spectrum across the camera’s two-dimensional rectangular surface. In this manner, the ratio of the spectrometer’s range and resolution could be as high as the number of camera pixels, ~107, allowing the measurement of pulses with a TBP of ~106. Depending on the required spectral resolution and range, a grating and an etalon could be used.
One drawback of MUD TADPOLE and the echelle-spectrometer approach is that they require a camera, and camera technology refresh rates are currently limited to—at most—kilohertz rates. In true arbitrary-waveform generation, each pulse in the train will not only be extremely complex but will also be different, as was the case with the continuum. Thus, it is important for the measurement technique to be able to rapidly measure many different pulses in rapid succession.
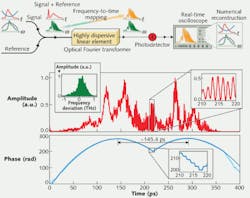
Another clever version of SI addresses this issue.11 It takes advantage of the fact that, because SI measures only the difference in spectral phase between the known and unknown pulses, the two pulses can experience significant spectral-phase distortions along the way to the detector—as long as the two pulses see precisely the same distortions, which then cancel out. It also takes advantage of the interesting fact that, if a fiber is long enough, its group-velocity dispersion will be so large that (typically) the longest wavelengths will emerge long before the pulse’s intermediate wavelengths, which will then emerge long before the pulse’s shortest wavelengths. In other words, the output pulse intensity vs. time will be the pulse spectrum vs. frequency, and, even better, the temporal resolution to measure it is relatively slow. Thus, a simple long fiber can become a spectrometer or a spectral interferometer when its output is measured in time, usually on an oscilloscope. And because oscilloscopes have very rapid refresh rates—several orders of magnitude more rapid than cameras—such a device can measure complex pulses in very rapid succession. Time bandwidth products as large as 900 (involving a 350 ps range and 400 fs temporal resolution) have been achieved with an impressive refresh rate of 17 MHz (see Fig. 3).
With these new techniques, pulses considered immeasurable only 20 years ago are now easily characterized. But are these techniques enough? Can all pulse-measurement researchers retire? Probably not! Propagation of laser pulses through even the simplest real-world media, such as human tissue, can easily yield much more complex pulses in time (and space) than those discussed here. Even a light bulb emits far more complex light and remains describable only statistically. But if progress in the next few years is at all like that of the previous few, techniques for their measurement are closer than ever.
REFERENCES
1. T. Brixner, A. Oehrlein, M. Strehle, and G. Gerber, “Feedback-controlled femtosecond pulse shaping,” Appl. Phy. B(Lasers and Optics), Ultrafast Optics 1999 (Jul. 12–16, 1999), B70 (suppl. issue), 119 (2000).
2. D.R. Solli, C. Ropers, P. Koonath, and B. Jalali, “Optical rogue waves,” Nature, 450, 13, 1054 (2007).
3. S.T. Cundiff and A.M. Weiner, “Optical arbitrary waveform generation,” Nature Photon., 4, 760 (2010).
4. R. Trebino, Frequency-resolved Optical Gating: The Measurement of Ultrashort Laser Pulses, Boston: Kluwer Academic Publishers (2002).
5. P. Schlup, O. Masihzadeh, L. Xu, R. Trebino, and R.A. Bartels, “Tomographic retrieval of the polarization state of an ultrafast laser pulse,” Opt. Lett., 33, 267 (2008).
6. X. Gu et al., “Frequency-resolved optical gating and single-shot spectral measurements reveal fine structure in microstructure-fiber continuum,” Opt. Lett., 27, 13, 1174 (2002).
7. C. Froehly, A. Lacourt, and J.C. Vienot, “Time impulse response and time frequency response of optical pupils,” Nouvelle Revue D’Optique, 4, 183 (1973).
8. P. Bowlan et al., “Crossed-beam spectral interferometry: A simple, high-spectral-resolution method for completely characterizing complex ultrashort pulses in real time,” Opt. Exp., 14, 24, 11892 (2006).
9. J. Cohen, P. Bowlan, V. Chauhan, P. Vaughan, and R. Trebino, “Measuring extremely complex pulses with time-bandwidth products exceeding 65,000 using multiple-delay crossed-beam spectral interferometry,” Opt. Exp., 18, 24, 24451 (2010).
10. J. Cohen, P. Bowlan, V. Chauhan, P. Vaughan, and R. Trebino, “Single-shot multiple-delay crossed-beam spectral interferometry for measuring extremely complex pulses,” Opt. Comm., in press (2011).
11. M.H. Asghari, Y. Park, and J. Azaña, “Complex-field measurement of ultrafast dynamic optical waveforms based on real-time spectral interferometry,” Opt. Exp., 18, 16, 16526 (2010).
Rick Trebino is a professor of physics at the Georgia Institute of Technology, Atlanta, GA 30332; e-mail: [email protected].


