BIOPHOTONICS: Super-resolution STED microscopy advances with yellow CW OPSL

Researchers have a growing need to push optical microscopy beyond the diffraction limit to answer key questions in biology, and stimulated emission depletion (STED) has proven to be a fluorescence imaging technique that can accomplish this goal.1 Initially demonstrated with ultrafast pulsed lasers, STED with continuous-wave (CW) lasers is much simpler and less costly to implement.2 When combined with a gated detection scheme, it subjects the samples to much lower laser powers, which helps minimize cell photodamage when performing live cell imaging.3
This article describes the first use of a CW, 577 nm OPSL, which offers the lowest output noise in this biologically important spectral region for the STED effect. It also reviews the use of this system for combining STED with fluorescence correlation spectroscopy (FCS), which for example allows the observation of the nanoscale movement and interaction of molecules in cell membranes.4
STED nanoscopy
Biologists are currently seeking to connect molecular behavior to macroscopic behavior—for example, determining how cells signal with each other, and how signaling at the cellular/organism level is then relayed back to DNA/RNA level control to regulate single genes. This means connecting chemistry, activity, and structure at the highest possible spatial resolution, and with sufficient temporal resolution to follow dynamic sub-cellular events in real time.
Fluorescence microscopy underpins much of this important research – using dyes, labels or fluorescently tagged gene products to map the location and movement of specific molecules and/or ions (e.g., Ca2+). However, the spatial resolution of optical microscopy is limited by diffraction to a level of detail roughly equal to half the wavelength of the light source being used.
Techniques including multiphoton excitation, structured illumination, or 4-Pi microscopy have pushed this barrier in spatial resolution as given by diffraction to its absolute limits, but they cannot truly break it and cannot deliver unlimited resolution. STED microscopy has emerged as the first approach that can in principle deliver 3D images with unlimited spatial resolution, and which has broad applicability and speed.1 As a result, STED can be implemented in experiments that probe nanoscale biological events in real time. More importantly, it is now showing the potential to enable these studies in live cells.
The STED technique
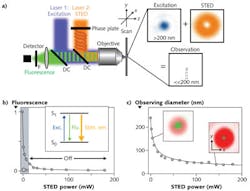
A STED nanoscope uses two laser beams. The first is the excitation laser, which as in confocal microscopy is usually focused to a near-diffraction-limited spot within a fluorescently labeled sample. The excitation wavelength of this laser is chosen to match the absorption peak of the target fluorophore(s).
In a confocal microscope, an aperture is used so that the photodetector can only “see” fluorescence excited at the x-y-z point coincident with the focused beam. A 3D image is then built up by x-y rastering this spot at successive z-axis depths.
In STED, the x-y-z volume from which molecules are detected is defined by the overlay of the excitation laser with a second (STED) laser beam, rather than a confocal aperture. Specifically, a phase mask is used to produce a focal intensity distribution with one or more zero-intensity points such as a donut-shaped beam with a dark (zero intensity) center (see Fig. 1). The STED laser wavelength is centered at a longer wavelength than the excitation laser and serves to inhibit the fluorophore’s excited state via stimulated emission.
When applying a high enough STED laser power above a certain threshold, all the excited fluorophores in the path of the STED beam emit at the STED wavelength making them unavailable for (spontaneous) fluorescence. As a result, fluorescence excited by the first laser can only occur in the dark hole in the middle of the STED donut. The reason why fluorescence inhibition can be used to define a sampling region that is smaller than the diffraction limit follows from its dependence on the laser intensity. So as the STED laser intensity is increased relative to the threshold for fluorescence inhibition by stimulated emission, the area in which fluorescence is still allowed (i.e., the area sampled by fluorescence detection) is effectively shrunk.
Depending on the setup and phase mask, STED can reduce the sampled volume just in the x-y plane or in all three spatial (x-y-z) axes.1 A 2D or 3D image is then built up by scanning the sample volume across the sample, just as with a confocal microscope. As already noted, the reduction in fluorescence volume and thus spatial resolution of the acquired images is in principle unlimited. In experiments so far, STED images have been acquired with a resolution down to 20 nm in cells and 5 nm in solid materials; i.e., with observation areas 1600-fold smaller than in the diffraction-limited confocal case.
Continuous-wave STED
Initially, STED was implemented using pulsed lasers where the STED pulse immediately follows the excitation pulse. This configuration realizes the most efficient fluorescence inhibition, since it ensures the most appropriate STED action in terms of high laser peak intensity and timing. However, these pulsed configurations usually require carefully synchronization of the lasers and require complex and costly laser systems such as modelocked laser systems.
These challenges are particularly true in the case of many live-cell experiments, where fluorescent labels such as the green or yellow fluorescent protein (GFP, YFP) are often used. Because these common fluorophores are optimized for blue excitation around 488 nm, this requires an optimum STED laser wavelength around 560–600 nm. For ultrafast pulses, this must be supplied by a optical parametric oscillator (OPO) pumped by a Ti:sapphire system.
Therefore, an important development in STED was to switch to the use of CW lasers. Combined with fast scanning, this allowed the recording of live-cell nanoscopy images.2,5 Here, scan rates of several kilohertz avoid building up a population of fluorophores in the triplet or other (“photo-unstable”) dark states, thereby minimizing photodamage.
Still, a disadvantage of such CW recordings is the continuous excitation during fluorescence detection, and hence a less pronounced fluorescence inhibition at the slopes of the zero-intensity point. The limitation is manifested as an additional blurring in the CW-STED images, compromising the separation of object details.3
This problem can be surpassed by implementing pulsed-laser excitation in combination with a CW-STED laser and time-gated detection. Importantly, this gated detection scheme allows the use of lower STED laser powers to realize enhanced spatial resolution, thus minimizing the photostress on the sample. In fact, gated CW-STED (gSTED) and fast scanning now enable the recording of live-cell images with CW-STED laser powers of less than 100 mW.3
gSTED requires low-noise CW laser
Fast-scanning gSTED nanoscopy puts rather specific demands on laser performance in terms of wavelength, power, and noise. An important prerequisite is the use of CW lasers with low noise, since any fluctuations in the power level compromise the performance.3 In terms of power, studies to date have needed between 100 and 250 mW of STED light at the sample.3 Because of losses in the phase mask and other optics, as well as the need for a normal experimental overhead, this translates into a requirement for a yellow laser with at least 2 W of power.
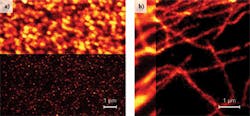
We therefore recently switched to an OPSL for this purpose—a Coherent Genesis, which is an OPSL delivering up to 3 W of output at 577 nm. This laser produces very low noise and results in a corresponding high degree of system sensitivity and data quality. This can be seen in the gSTED images obtained using the OPSL to deliver a power of 150 mW at the sample (see Fig. 2).Shown are 40 nm yellow fluorescent beads and the microtubule of mammalian cells labeled with the organic dye Alexa 488. Both the yellow fluorescent beads and the dye Alexa 488 were excited with a pulsed laser system at 488 nm and their emission bands are similar to GFP or YFP, i.e., optimized for the 577 nm OPSL system. These images illustrate the superior resolution of the gSTED technique over conventional diffraction-limited confocal images.
Combining gSTED with FCS
Many questions in cell biology require dynamic imaging. One of the authors’ research interests is studying the movement of lipid and protein molecules in cell membranes and investigating what role (if any) this movement plays in cell signaling. In layman’s terms, signaling means determining how a cell knows that it has touched another cell, how a nucleus knows what is happening at the outer cell membrane, or how a cell knows what an adjacent cell is doing.
While STED has proved well suited to imaging at speeds up to 80 frames/s1, this speed is still not high enough to follow all of the dynamics of the lipid membrane organization. A more sophisticated approach is to use fluorescence correlation spectroscopy (FCS) techniques to analyze the fluctuating intensity data as labeled lipids (or proteins) move in and out of the measurement volume.
This approach enables us to observe how these molecules interact on the nanoscale, and to observe any heterogeneity in their diffusion characteristics. For example, previous experiments on the use of STED in conjunction with FCS have delivered the spatial and temporal resolution to observe differences between free and hindered motion of fluorescently labeled lipid molecules, and revealed new information about the spatial and temporal scale of their interactions.4
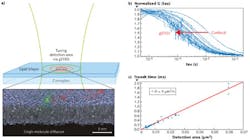
These first STED-FCS measurements were done using pulsed STED lasers; however, the combination of CW lasers and gated detection has proven to be advantageous for FCS studies.3 Measuring fluctuations in the fluorescence signal using FCS or STED-FCS requires the use of very low noise lasers. Therefore, we again used the 577 nm OPSL to enables gSTED-FCS measurements of BODIPY-labeled lipids in a supported lipid membrane (see Fig. 3).The recording of accurate gSTED-FCS data is possible for observation areas down to 50 nm in diameter (by increasing both the STED power as well as optimizing the timing of the gated detection3). The transit times of the lipids through the observation area depend linearly on the area’s size, indicating free Brownian diffusion as expected in these kind of model systems.4
REFERENCES
1. S.W.Hell, “Far-Field Optical Nanoscopy,” Science, 316, 1153–1158 (2007).
2. K.I. Willig, B. Harke, R. Medda, and S.W. Hell, “STED microscopy with continuous wave beams,” Nat. Methods, 4, 915–918, (2007).
3. G. Vicidomini et al., “Sharper low-power STED nanoscopy by time gating,” Nat. Methods, 8, 571–573 (2011).
4. C. Eggeling et al., “Direct observation of the nanoscale dynamics of membrane lipids in a living cell,” Nature, 457, 1159–U1121 (2009).
5. G.R. Moneron et al, “Fast STED microscopy with continuous wave fiber lasers,” Opt. Exp., 18, 1302–1309 (2010).
OPSL technology: Scalable power and wavelength with low output noise
OPSL technology has proven a particularly good match for the requirements of STED because of its broad power and wavelength scalability, as well as its inherently low noise. These all stem from the use of a thin, semiconductor chip as the gain material, pumped by long-lived laser diodes.
Power is scaled by increasing the size of the gain disk, pumping with additional diodes, or even using several gain chips in series in a “zigzag” cavity. Increasing power causes no thermal lensing issues because the gain chip is efficiently cooled across its entire rear surface, which is mounted on an active heat sink. The lack of thermal lensing also means that the output power of an OPSL can be smoothly adjusted from 10–100% of maximum, with no changes in beam properties or pointing.
Power adjustability is an important attribute because the user must carefully trade high power for driving saturation in the STED effect while avoiding damage to live cells. And, with sub-diffraction spatial resolution, it is just as important that this power adjustment does not change far-field beam position or shape.
Wavelength scaling is possible because the output wavelength of an OPSL is determined by the size and stoichiometry of the quantum-well emitters in the semiconductor. These factors can be designed as needed to deliver an output wavelength over a wide part of the visible spectrum.
As the many visible lasers based on all solid-state technology, the fundamental OPSL wavelength is in the near-IR and is converted to the visible by efficient intra-cavity doubling. With multi-longitudinal mode lasers based on a crystal gain medium, intra-cavity doubling produces noise due to chaotic coupling of the modes, often called the “green problem.” But the near-zero, excited-state lifetime of the OPSL gain medium eliminates the basic mechanism of this mode chaos (see Laser Focus World, September 2006). So, even when operating on multiple longitudinal modes, an OPSL can deliver lower output noise than most other solid-state lasers.
Matthias Schulze | Director of Marketing, OEM Components and Instrumentation at Coherent
Matthias Schulze is Director of Marketing, OEM Components and Instrumentation at Coherent (Santa Clara, CA).
Arnaud Lepert | General Manager, HOPS Business Unit at Coherent
Arnaud Lepert is General Manager, HOPS Business Unit at Coherent (Santa Clara, CA).
Christian Eggeling | Senior Scientist, Max-Planck-Institute for Biophysical Chemistry
Christian Eggeling is a Senior Scientist at the Max-Planck-Institute for Biophysical Chemistry (Göttingen, Germany).
Alf Honigmann | Research Group Leader, Department Nanobiophotonics at Max Planck Institute for Biophysical Chemistry
Alf Honigmann is Research Group Leader at the the Max Planck Institute for Biophysical Chemistry, Department Nanobiophotonics (Göttingen, Germany).

