SOFTWARE AND SUPPORT EQUIPMENT: Beam profiling finds use in industrial parts inspection
DICK RIELEY
A machine-vision inspection system combines an imaging device, typically a camera, with a computer and image-processing software that counts pixels, measures objects, recognizes patterns, and detects edges. A laser-beam profiling system relies on a similar combination of technologies—camera, computer, specialized software—but provides a unique set of diagnostic functions, including International Organization for Standardization (ISO) beam size, shape, and diameter measurements, and 2D and 3D graphical images of the beam profile.
Recently, a high-volume manufacturer of molded devices was confronted with a challenge. The company needed to measure the size and shape of a hole that measured less than 100 μm in both width and depth. The machine-vision approach was effective at measuring the diameter and ellipticity of the hole from both sides of the device. However, the technique was unable to detect a blockage of any type or the thickness inside the hole. As a result, many holes were inspected as "acceptable," but later rejected upon follow-up inspection.
Limitations
If the hole was out-of-round or not the correct diameter, the vision system correctly rejected these conditions. However, in a high-speed inspection process where a blockage internal to the hole could not be satisfactorily detected, the machine-vision system would provide an unacceptable False/Accept rate that would defeat the benefits of the automated process.
A specific amount of material needed to pass through the hole during final assembly. Since the device cannot be tested until fully assembled, any device found to have the incorrect hole size or that does not pass the correct volume of material must be rejected and reworked, thereby reducing productivity. Being able to inspect and sort acceptable from unacceptable prior to final assembly would also represent significant cost savings.
It was necessary to have a hole of the correct size that was free and clear of any internal obstructions. The manufacturer tested a vision inspection system that measured both sides of the <100 μm hole. Although this approach could detect the hole diameter accurately, it could not detect obstructions inside the hole that developed during the forming process.
Automated inspection using beam profiling
The manufacturer tested an alternative approach using a 4.4-μm-pixel SP620 USB camera running BeamGage software from Ophir-Spiricon. The goals were to determine if the correct hole size could be detected and if the hole was free and clear of any obstructive material. For this test, Ophir-Spiricon was provided with devices that had been pre-inspected as acceptable and other devices that had been pre-inspected as rejectable.
The proposed test used a stationary light source positioned 2 in. above the device and centered over the hole under test, with the light passing through the hole and then diverging. The camera was positioned beneath the device, facing toward the light column coming through the hole. The concept was that from a hole of an acceptable size, the diameter of the exiting beam of light would be a constant and repeatable size. With a hole that was too large (which was typically the failure mode), the beam would be larger and, by precision measurement, sorted out as unacceptable.
This approach was presented as a near-dynamic test; that is, light passing through the hole would be considered similar to a material passing through the hole as in the final assembled product. Using the pre-inspected acceptable devices, the correct diameter for the center hole was established. These discs were used to establish a baseline that was considered numerically acceptable as compared to the devices that had been determined unacceptable where the diameter of the hole was too large by specification.
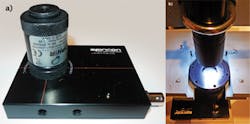
In this setup, the molded part was positioned face down with a light source entering the device from the back side. Figure 1 shows the fixed-position light source, the device, and the camera beneath the device.
The use of beam-profiling software demonstrated that there were two possible measurements that would better qualify a device: first, the USB camera can provide a static measurement of the size of the hole (similar to the machine-vision system), and second, the camera can dynamically measure the amount of light intensity coming through the hole.
It was shown that this dual-measurement approach would be more conclusive, as the amount of light coming through the hole is more closely associated with the actual function of the device, which is to allow a certain amount of flow through the hole necessary to meet specification once installed in the final assembly.
Two qualifications required
The significance of this inspection method is that a device to be accepted must meet both measurement criteria: correct hole size and amount of light penetrating the same hole. Meeting only one or the other criteria represents a reject.
Using the beam-profiling software's data-analysis functions, the camera can easily make a static measurement of the hole diameter in both the x and y dimensions based on the size of the light beam coming through the hole. This can be done with ±1% accuracy. Part of this measurement is the calculation of ellipticity, which is displayed as a percentage (100% is a perfectly round hole). This secondary measurement allows a "min-max" tolerance standard to be set to reject out-of-round holes. For example, the hole may be out-of-round, but the volume of light penetration may be to specification. For this inspection process, both size and volume standards must be met to accept the product.
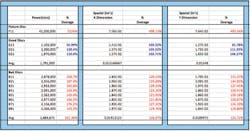
The beam-profiling software can also measure light intensity in the form of power (mW) or just a numerical count, as was used with this analysis. This dynamic approach can determine the size of the hole by measuring the intensity of the light passing through it. There is a direct correlation between beam size and the amount of light intensity measured. Even in the case where the hole may not allow the right volume of light to penetrate, the hole size may meet specification. Such a reject is likely due to an obstruction inside the hole that does not affect the size, but only the volume of the light attempting to penetrate the hole. Figure 2 is an example of the image and measurement values of the beam size and beam intensity from each of the measurements.
Explanation and results
In the Power/Energy section of Figure 2, light passing through the hole is measured in units of "counts." This measurement is an absolute value and is repeatable and consistent. This value can also be calibrated to live power and displayed in the appropriate power units. In the Spatial section, the hole diameter is displayed using a 4-sigma measurement formula for both x and y dimensions based on the light beam penetrating the hole.
In the actual measurement, each of the devices was scanned. Figure 3 shows the actual values for intensity, as well as for the dimensional measurement of the beam. The values from the good devices were used to calculate an average. That average was compared against the actual values of the rejectable devices. Also shown is the percentage of difference off the average. In all 12 devices, the data for both the intensity measurement and the dimensional measurement tracked with the pre-inspection results.
Good devices were detected and accepted without exception. These good devices were used to establish a baseline of acceptability for hole diameter, giving an average of 1.515 × 10⁻² for x and 1.548 × 10⁻² for y. The rejected devices were measured to be on the average 26% greater in x and 22% greater in y. The good devices were used to establish a baseline of acceptability; an average of 1,791,000 intensity counts was seen. Every single one of the devices pre-inspected as rejected was rejected by this means with a measured value greater than 61%.
Based on this sample of acceptable and rejectable devices, using both the dynamic intensity measurement as well as the static beam-diameter measurement, there was a sizeable separation between these two populations. In a production environment, the beam-profiling software allows minimum/maximum limits to be established on measurements of this type, while offering a variety of outputs for manufacturing production control.
Dick Rieley is mid-Atlantic sales manager at Ophir Photonics Group, Logan, UT; email: [email protected];www.ophiropt.com/laser-measurement.


