Photonics Applied: Energy: Multivariate optical computing enables accurate harsh-environment sensing for the oil and gas industry
CHRISTOPHER MICHAEL JONES, ROBERT FREESE, DAVID PERKINS, and BIN DAI
For exploration and production of reservoir fluids in the oil and gas industry, it is greatly desired that information about the quality of the fluid be obtained as quickly as possible for petroleum-asset management.1 In the past, methods were used to obtain a representative sample of the fluids soon after drilling. This sample would then be sent to a lab for analysis to determine bulk physical properties, phase behavior, and chemical composition (for example saturated or aromatic hydrocarbons).
This analysis and characterization of the reservoir fluid allows production strategies to be developed, and is used to determine the economic value of the reservoir. However, the quality of the fluid sample can be affected by the presence of drilling-fluid filtrate contaminating the collected sample. In addition, the time to deliver and analyze the sample in this fashion is time consuming and results in sparse data.
The drive for increased quality of collected samples led to sensors being placed within the drilling and evaluation equipment, which allows reservoir-formation evaluation engineers to monitor the fluids during the pump-out phase to evaluate the transition from drilling fluid to reservoir fluid. This evaluation can be difficult in many cases where the drilling-fluid filtrate is composed of oil-based mud (OBM), which shares some physical properties with those of the reservoir fluid.2
Chemical sensors, such as those based on optical spectroscopy, are sensitive to the differences between OBM and reservoir fluids. Optical spectroscopy is a universal technique widely used in laboratories to measure physical and chemical properties of different materials, including petroleum, geological, and hydrological samples. Optical instruments, such as photometers or filter spectrometers, have been adapted in downhole oil-field environments using restricted spectral bandwidths from visible to near-infrared. Other attempts have adapted conventional grating-based spectrometers for use downhole.
These instruments, however, are limited compared to laboratory spectrometers, which can use a much broader light spectrum with greater sensitivity and accuracy. Photometers and grating spectrometers trade resolution and power for stability over a narrow spectral bandwidth. Recent laboratory studies of ruggedized optical field equipment have suggested gas/oil ratio (GOR) accuracies of 185 standard cubic feet per stock tank barrel (scf/stb) for medium and heavy oils and 726 scf/stb for volatile oil, or 16 to 20%. These techniques have also provided light hydrocarbon gas composition, carbon dioxide composition, and hexane-or-higher (C6+) composition as saturates.3
Suited to harsh conditions
Multivariate optical computing (MOC) is a technique by which an analog calculation is performed entirely in the optical domain. The calculation is a dot-product multiplication for a vector encoded as the spectral transmission function of an optical element and the spectral intensity of light passing through the element. By matching transmission of the element to a multivariate regression vector, chemical information is extracted.
MOC combines the simplicity and ruggedness found in photometers, while having the accuracy and sensitivities found in laboratory spectrometers due to the wider spectral bandwidth and higher signal-to-nose ratios (SNRs) they possess.4 MOC devices use a broadband light source to interact with the reservoir fluid, for example, by transmission. Information about the sample is encoded into the optical domain. This encoded light from the sample is directed to a multivariate optical element (MOE), which is an optical-interference-based device designed to operate over a continuum of wavelengths in the electromagnetic spectrum from the UV to mid-infrared (MIR) ranges, or any subset of that region.
The element itself is encoded with a regression vector in the form of a transmission profile.5 The element modifies and processes the light that optically interacts with the sample. A detector reads the modified light, thus correlating an output of the detector to the physical or chemical property of the substance under analysis. Previous demonstrations of MOC in the visible region have shown that the throughput and efficiency of these devices can be two to four orders of magnitude higher than conventional spectrometers using low-cost silicon photodiodes.6
The element is fabricated on an optical substrate using alternating layers of thin-film materials. The number and thicknesses of the layers and the complex indices of refraction of the materials and substrate are selected to determine the transmission profile of the element to incorporate the features of a regression vector. These factors are referred to as the design of the element.
The design of the element results in a linear relationship between the component of interest in the sample (for example, GOR or methane) and the transmittance through the MOC device. MOC systems are advantageous for high-temperature and high-pressure applications because the optical components used (MOC, source, and detector) are inherently stable. In addition, temperature effects, such as the change in transmission characteristics for various components, can be measured and corrected for in the design of the element or in signal processing.
For use in downhole reservoir-fluid characterization, the elements were designed and fabricated for GOR and methane and tested in simulated downhole conditions (150°–325°F and 3000–12,000 psi) in a laboratory-based instrument.7 Successful field tests were conducted for an sensors-based MOC platform built into a wireline formation tester (WFT) to validate the sensors in downhole operational conditions.8
Application for wireline MOC
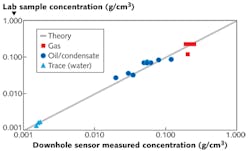
Halliburton has developed an MOC-based fluid-analysis service using chemical sensors in a subterranean oil well (see Fig. 1). Total methane concentration in grams methane per milliliter of oil and total dissolved hydrocarbon gas content expressed as a ratio (GOR) in standard cubic feet per barrel of liquid at stock tank conditions were targeted for first use. Regression vectors were developed as MOC sensors transmitted information using laboratory data measured on oils collected from 17 countries recombined to different dissolved gas concentrations at temperature and pressure conditions varying from 150°–350°F and from 3000–20,000 psi.
In such environments, conditions can reach 350°F and 20,000 psi. The MOC sensors are designed to be stable across the entire specified temperature range. Because the MOC sensors transmit a large fraction of incident light without dispersion or division, as is in the case of most spectrometers, less sensitive but more robust thermopile detectors may be used. An identical inline reverse-wired dark-reference thermopile provides analog subtraction of thermal effects prior to signal amplification. Additional detector signal stability is achieved by total sensor temperature characterization.
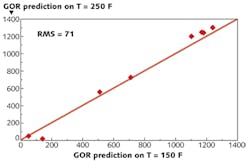
Figure 2 shows a comparison of eight reference fluids measured in a laboratory for a sensor stabilized at 150°F and 250°F, respectively. It should be noted that the off-trend point may actually be a reference measurement error as sample handling is difficult. Nonetheless, the plot clearly shows that the measurement is repeatable to within about 5% of the GOR scf/barrel (scf/bbl) range, which is not significantly different from the calibration standard error of prediction of 85 GOR scf/bbl.Any sensor operating in a subterranean oil well must survive strong vibration and shock. MOC sensors are fabricated and placed into a rotating carousel in a compact arrangement. With the MOC sensors, no geometric wavelength dispersion of a spectrum takes place, affording a short distance between light source and detector. This distance is less than 33 mm, and with a clear aperture of 6 mm, this allows a liberal alignment tolerance and superior vibration and shock stability. The compact arrangement allows for a thick pressure housing to protect the optics in a 150-mm-diameter package when in the oil well.
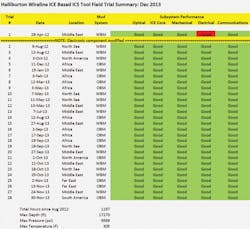
Figure 3 shows the track record of the four optical sensors deployed in downhole oil wells to measure methane concentration and GOR, representing 18 months of field testing for this sensor design. After a redesign of the power-supply electronics, the sensor did not experience failure for the remaining 14 months. The sensors are deployed in a retrievable platform configuration with the sensor lowered into the oil well on a wire cable. The wire supplies both power and communication to the surface. Optical readings are taken downhole with the readings communicated to the surface for real time assessment.In the well, a removable pump pulls fluid from the rock formation (formation fluid) into this sensor for measurement; subsequently, when the sample is believed to be representative of the formation fluid, that sample is captured into a pressurized sample chamber. These sample chambers are taken to laboratories for analysis.
Gathering a representative sample is a very difficult process. Many times samples are of sufficiently low quality as to be considered not representative of the native petroleum in the formation where it was sampled. Additionally the sample may change during transport due to fractionation across internal seals or external leaks.Other applications
The MOC fluid-analysis service has a myriad of potential applications, both surface and subsurface, in the oil and gas industry. The technology is primarily used to measure chemical compositions; the nature of the technique has proven to do so in a very robust manner. As MOC sensor technology may be used in a variety of challenging environments, optical analysis may be possible via MOC in situations where optical analysis has traditionally proved difficult. Following are brief summaries of a few oil and gas applications intended to convey the wide diversity of uses.
1. Field stimulation and produced waters: Water and water matrices are used ubiquitously to stimulate production fields or create flow paths via fracking. In these applications, it is important to treat the waters before sending them downhole to ameliorate undesirable contaminants. One example contaminant is bacteria, especially anaerobic bacteria, which can survive and grow underground and impede the effectiveness of the treatment. MOC technology has been shown to be sensitive to bacterial species and could be employed to monitor the efficacy of the bacteria treatments and help ensure that acceptable bacteria levels are achieved by sensing the concentration of live bacteria in real time.
2. Cementing: Cement formulations for oil and gas applications are complex and involve many different additives to achieve appropriate performance. These additives may, for example, increase or decrease the density of the cement, or increase or decrease the cure times, or may be adapted to a variety of environments. Cements and additives are typically blended in dry-powder form in a batch-blending process, and it is important that the blended cement formulations are uniform in nature. MOC technology may be employed to monitor the blending process in real time and help ensure that optimal blending is achieved for each batch.
3. Drilling fluids/muds: Drilling muds are employed ubiquitously in the oil and gas industry for drilling wells. As the name implies, the drilling-fluid mud is a stable mixture of liquids and clay-sized particles. The liquid of this mud may be either oil-based or saltwater-based. The mud counter-balances the pressure of the subterranean formations and keeps them from collapsing; cools and lubricates the drilling bit; and carries the rock cuttings created by the drilling process to the surface. As in cement, the mud formulations are complex and tuned for each specific job. MOC technology can be used, in real time, to ensure that the formulations are proper. In addition, mud properties and constituents are known to change during the drilling process as the return mud chemistry is altered during its transit downhole. Once again, MOC technology can be employed to sense the changes in mud chemistry, and provide information in real time as to how the mud should be treated before it is sent back downhole to maintain appropriate specifications and properties.
4. Pipeline assurance: Oil represents a variety of compositions that can mix to form difficult-to-manage formulations. Two fluid crude oils, for instance, may mix and form a viscous tar, or gel. The fluids may freeze with hydrates, or the water portion form inorganic scale deposits, or corrode the pipeline. Knowing the composition of the oils and waters allows for proper treatment of the fluids to ensure flow, or ensure that proper treatment has been applied.
Real-time in situ measurement
MOC technology offers great advantages for oil and gas exploration. The robustness of the MOC solution is well-suited for the harsh environments of oil and gas exploration wells, and the challenging environments at the rigsite. MOC sensors have logged over 1000 h in downhole environments at temperatures greater than 300°F and pressures greater than 9500 psi.
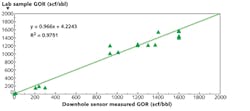
Although chromatography and mass-spectrometer techniques do typically perform with better than 1% accuracy for GOR, laboratory FTIR analysis typically performs with 6% accuracy. Field accuracy has been shown to be 8.5% accurate for GOR from 0 to 1600 scf/bbl. The real value of MOC technology is in allowing real-time determination of chemical information in situ. Currently, this downhole fluid analysis can only be achieved by optical means.
REFERENCES
1. H. Elshahawi, et al., SPE Reserv. Evalu. Eng. 10 (3), 241–250 (2007).
2. R. Chemali, et al., Anal. Chem. 49 (2), 297–302 (1977).
3. V. Achourov, et al., "Applications of accurate in situ fluid analysis in the North Sea," pres. at Offshore Europe Oil and Gas Conf. and Exh., Aberdeen, UK (2001), paper SPE 145643.
4. M.P. Nelson, et al., Anal. Chem., 70 (1), 73–82 (1998).
5. M.L. Myrick, et al., Vibr. Spectrosc., 28 (10), 73–81 (2002).
6. M. L. Myrick, Laser Focus World, March 2002.
7. C. Jones, et al., "Laboratory quality optical analysis in harsh environments," pres. at SPE Annual Technical Conf. and Expo., San Antonio, TX (2012), paper SPE 163289.
8. K.O. Eriksen, et al., "Field tests of a new optical sensor based on integrated computational elements," pres. at SPE Technical Conf. and Expo, New Orleans, LA (2013), paper SPE 166415.
Christopher Michael Jones, Robert Freese, David Perkins, and Bin Dai are with Halliburton, Houston, TX; email: [email protected]; www.halliburton.com.


