Optical Filters: Optical filter performance keeps improving-measurement techniques must keep pace
The telecom boom of the late 1990s drove advances in many different technologies, not the least being optical filter technology. Telecom needed dense wavelength division multiplying (DWDM) filters with superior performance, which spurred optical coating innovation. Since then, life sciences and space exploration have continued to drive performance requirements and revolutionize expectations of how we can manipulate light. These fields have further challenged filter manufacturers to deliver on ever-more demanding specifications. System designers now often demand tight requirements such as deep optical density (OD) blocking coupled with nearly vertical transitions from low signal to high transmission.
Filter manufacturers are becoming adept at meeting these tough requirements—in fact, filter fabricators often manufacture their components to specifications so tight they can't be routinely measured. The question with today's high-performance filters becomes: How do you verify they meet their specifications?
Is your filter made to spec?
Verifying that your filter is made to spec is not simple. Most commercial spectrophotometers do not simply provide an accurate spectral curve; the operator must have some insight into the measurement method. In other words, without proper understanding of how the spectrophotometer works, and optical limitations of its components, the measurement may not be completely accurate using just "standard" settings. That puts a heavy burden on the user to acquire information about the inspection activities. The same is true for performing root cause analysis of problems with multi-element systems, where accurate measurement at the component level is critical for troubleshooting. Any measurement is a function of instrument accuracy, but the issue is particularly challenging for measuring precision filters, where the scale of the spectral features can be finer than the resolution of the instrument.
Because modern spectrophotometers are easy to use, operators often overlook the fact that spectral measurements are not a one-size-fits-all proposition. The measurement approach can vary depending on the type of filter and which feature of the curve requires further analysis. For most high-performance filters, some optics knowledge goes a long way to assess spectral conformance or, at the very least, understanding of the limitations of most commercial spectrophotometers. The following example discusses a few common limitations of most measurement instruments.
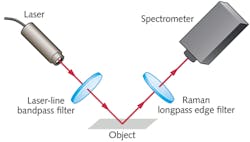
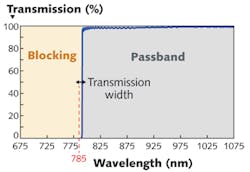
Let's say you need to evaluate a 785 nm Raman longpass edge filter for integration into a spectroscopy setup for a fluorescence imaging system using confocal Raman microscopy, similar to Figure 1. The excitation and emission modes of the fluorophore of interest can be similar in wavelength, so the transition width of the filter (distance in nanometers from 50% to 785 nm laser-line) often needs to be <1% or better. In addition, the intensity of the returned Raman signal is inversely proportional to the fourth power of the excitation wavelength—that's on the order of 1012 smaller than the excitation intensity.
This means the filter requires very deep attenuation at 785 nm to block any residual laser light emitted from the sample, typically requiring an optical density (OD) >6. Any superfluous light needs to be completely attenuated to detect the extremely small emission signal. Likewise, the transmission of the passband needs to be optimized to transmit as much of the signal wavelength as possible. The spectral performance for the Raman longpass edge filter would resemble Figure 2.For components like this Raman precision filter, the measurement problem becomes three-fold:
- Confirm transmission of the passband
- Resolve and verify the steepness of the nearly vertical edge is <1%
- Measure the blocking to ensure >OD6 @ 785 nm.
Confirming the transmission of the passband is straightforward and can be performed with any well-calibrated spectrophotometer. The difficulty comes when moving toward the transition edge and beyond to the verification of the OD of the blocking. Determining these values often requires more than one scan, with tradeoffs as to what can be achieved with each measurement. One could bump up the integration time and scan at 0.25–0.50 nm step intervals to achieve the accuracy needed, but time becomes a major factor and single scans could last up to 30 minutes or longer depending on the desired results.
Effects of spectrophotometer bandwidth
When measuring the very narrow spectral edge of precision filters, you need special care to avoid misleading artifacts. First, the resolution of the instrument can cause a theoretical "square" edge to become a "rounded" edge during the transition from the high transmission region. This is directly related to the spectral bandwidth and area of the diffraction grating—the larger the area of diffraction, the higher the resolution.
For a grating with a given number of lines/mm, a larger grating area provides higher resolution, but adds to the size and cost of the instrument. Similarly, the resolution can be increased by reducing the spectral bandwidth (SBW) parameter, but this has the effect of reducing the amount of light through the instrument, which, in turn, reduces the sensitivity at the detector.
The location of the edge in wavelength space is also important—if the light source is non-collimated and some f/# (cone angle) is present, the edge will exhibit a minor shift. Most spectrophotometers are not perfectly collimated, so it's best to use very small apertures when measuring to restrict the light to on-axis performance. Again, this decreases the amount of light in and the sensitivity of the system.
Traveling further down the edge of the filter to the 0.1–0.01% region, a "shoulder" or a "sideband measurement artifact" may appear. This feature is unique to very steep transition measurements from high blocking to high transmission, much like this Raman longpass edge filter. It arises from the non-monochromatic illumination source and SBW effect discussed above.
The instrument scans over a wavelength on the very steep edge and with a non-zero SBW. The finite spectral bandwidth means that instead of being attenuated at the actual OD level of the filter, additional periphery wavelength noise is transmitted by the filter within the band, registering as a signal on the detector. The sum of primary and periphery signals leads to a higher intensity reading than what is actually present. In a commercial instrument, there is little that can be done to reduce this shoulder, except add supplementary filtering in the measurement path.
When there is not much to measure
Lastly, the third measurement problem arises from sensitivity limitations. As mentioned, a filter having a high attenuation (OD >5) has very little light reaching the detector, so you are actually measuring the absence of light. The optical and electronic noise at the detector limits the lowest signal that can be measured accurately.
Recall that the Raman signal we are trying to measure is on the order of 1012 smaller than the excitation signal, and most detectors have a dynamic range of 106, which is highly wavelength-dependent. This effect is referred to as a "noise floor." The result is a flat, noisy spectrum that bottoms out at some minimum, even though the theoretical design is known to perform much better.
The noise floor can be reduced by increasing the grating SBW, thus allowing more light, which can allow for higher OD measurement. However, this increased sensitivity results in reduced spectral resolution. Another way to address noise floor is to "baseline" the unit with a rear beam attenuator, which helps bias the dynamic range of the detector.
So, although it's theoretically feasible to manufacture optical filters with edge transitions <0.2% and blocking OD >10, the measurement is not yet credible. This is why you often see the fine print "by design" on filter specs—vendors are not reluctant to admit these limitations. Experienced filter manufacturers have built custom in-house solutions to address the measurement shortcomings, which might involve a monochromatic high-intensity light source to circumvent the sensitivity issues, in addition to photomultiplier tube arrays for single photon detection.
However, most consumers are limited to commercial options and can find themselves performing up to three separate measurements, varying instrument parameters like SBW, detector changeover λ, interval step-size, integration time, and rear beam configuration in order to analyze distinct features of filter performance.
The future of high-performance filter measurement
You can imagine that measuring a steep fluorescence bandpass filter, with <1% transitions at either side of the passband and extended OD6 blocking over the entire visible range, is difficult. Ultra-narrow filters are even more problematic. These filters have bandwidths <1 nm, which really test an instrument's resolution capabilities. As design progresses further, measurement will become increasingly more challenging.
Today, optical filters permeate many industries with a diverse range of applications. Not every customer has the luxury to have an optics expert on their staff available to test and evaluate procured components. It's customary for the filter vendor to provide a performance curve, but it's helpful if the customer is equipped to interpret data they receive and associate results with known measurement limitations.
Most filter-focused companies can manufacture filters to much tighter specifications than even they can confirm. The marketplace demand for filters, in turn, needs to drive the technology to enable more credible measurement in high-performance regimes: the next breakthrough required to really push the boundaries of optical filter technology.
Amber Czajkowski | Product Line Manager, Alluxa
Amber Czajkowski is product line manager at Alluxa (Santa Rosa, CA); she previously served as a thin-film engineer at Edmund Optics (Barrington, NJ) from 2009 through 2014.
Stephan Briggs | Biomedical Product Line Engineer, Edmund Optics
Stephan Briggs started with Edmund Optics as an intern while pursuing his degree in biomedical engineering at Drexel University with a concentration on tissue engineering and biomaterials. Following graduation, he joined as Biomedical Engineer, working directly with EO’s life sciences customers. With a solid understanding of processes and technologies, he helps researchers and system builders accomplish their goals with correct application and integration of components and subsystems. He has authored numerous articles on a range of topics of interest to life scientists, including light sources, optics, individual and combined imaging approaches, and cost-efficient design options.

