Spectroscopy: Hyperspectral imaging opens new perspectives in cultural heritage
GREG BEARMAN and CHRISTOPHER VAN VEEN
The past quarter-century has seen great strides in the abilities of imaging technologies, resulting in unprecedented growth of interest in their application to art, ancient texts, and cultural heritage in general. Some methods have become almost routine, such as spectral imaging and reflectance transformation imaging. While the focus here will be on spectral imaging applied to cultural heritage, the basics trace back several decades to military/defense/remote-sensing intelligence, surveillance, and reconnaissance applications using essentially the same technology aboard satellites and high-altitude surveillance aircraft.
Hyperspectral imaging captures all the spatial and spectral data that can be seen within the field of view of the imaging device. This new set of eyes gives users a more complete view of any type of reflecting material and is as much at home hundreds of miles above the earth as it is inside a museum, a library, or a university. Armed with spectral signatures denoting materials and chemistry, a crop scientist can detect disease conditions on the tops of fruit trees. A geologist can detect and map mineral deposits. A poultry producer can inspect birds for defects or diseases with high accuracy and speed. And a conservation-care professional can look at a painting or a cultural heritage artifact and learn about its origins, fabrication technology, and current condition while helping to better protect our cultural heritage.
Headwall has migrated hyperspectral imaging technology from the military domain to numerous commercial deployments where small size, low cost, and ease of use are considerations. This has led to the production of instruments (named Hyperspec) that focus on the ultraviolet-visible (UV-VIS) range up to the shortwave infrared (SWIR; 900–2500 nm) and beyond. While these instruments are often payloads aboard aircraft, satellites, and unmanned aerial vehicles (UAVs), many others are found in libraries, museums, universities, and research laboratories as a result of their ability to see the unseen.
Acquiring and processing the data
Spectral imaging provides the spectrum of every pixel in an image. Conceptually, the data is stacked up into an image cube with dimensions (x, y, λ), allowing us to obtain the spectrum of any point by following it through the image cube.
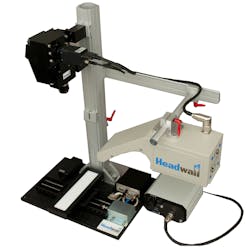
In an airborne or satellite-based application, the sensor flies over the field of view as it captures data. For a cultural-heritage application, the sensor remains stationary as the field of view moves beneath or in front of it. Other methods of acquiring this sort of data include pan and tilt of the sensor head, or the use of scanning optics where nothing moves except a mirror. Figure 1 shows a hyperspectral sensor arranged in a starter kit configuration, which represents a common deployment for the technology in this type of application.
Once we have the spectra, the user can segment, classify, and process the pixels based on their spectra. Most of the early work and development of spectral imaging came from remote sensing and NASA's planetary exploration program. Many tools from remote sensing are available for the cultural heritage user, including both commercial software and some freeware. Image analysis algorithms can be simply borrowed.
Spectral imaging for cultural heritage is changing rapidly. Applications range from unraveling ancient texts to providing quantitative data for conservators to help them detect, measure, and map changes in objects and sites under their care. Both uses are important and the same equipment and data set can often serve both purposes.
While nearly all of the work has been in the visible-near-infrared (VNIR), relatively new instruments have made it technically and economically feasible to image in SWIR and create chemical images of cultural heritage. This opens up entirely new areas of understanding fabrication technology, component chemistry, and identity. It also enables better repairs and restoration, and monitoring changes over time.
It is also true that most spectral data has been used for text analysis and some segmentation; recent work on quantitative spectral imaging identifies it as an effective tool for the conservator to map out changes, especially before they become visually apparent.
Early spectral imaging of texts
Historically, the first use of spectral imaging on texts was to explain the well-known and decades-long fact that IR photography with film often made illegible ancient texts legible. However, it was not always successful.
Perhaps the best example of this is the Dead Sea Scrolls, which were originally imaged in the 1950s with large-format IR film in order to make the text legible for scholars. Spectral imaging showed, in the early 1990s, that legibility is basically a contrast issue between the ink and parchment. The ink and parchment of easy-to-read fragments had very different reflectance in the visible, so they were legible to the eye and color or black-and-white film. Illegible fragments, it turned out, had very reduced parchment reflectance, so there was little contrast in the visible. However, for an unknown reason, the parchment reflectance increases significantly in the IR, so there is much more contrast between the ink and parchment. This early data was taken with a liquid-crystal tunable filter (LCTF)-based imaging system.1 While the scroll data is fairly simple spectrally, it illustrated the power of the method and led people to deal with more complicated text problems such as palimpsests and damaged or erased manuscripts.
It is important to note that the nature of the ink is critical to the success of the method. In the ancient Near East, inks were mostly a suspension of carbon soot in some binder medium. The formula was not standardized and neither was the production method of parchment, so each manuscript (while similar to others in some respects) is unique. Around the third century of the Common Era, iron-gall inks began to replace carbon-based inks. Made with other organics, these often contained iron and copper. Carbon inks, iron-gall inks, and modern inks all behave very differently spectrally.
In a palimpsest, for example, a text is scrubbed off and then written over. Many times the older text is carbon-based and the newer one is iron-gall; these have different spectra and can be classified and separated based on their spectral differences. A classic example of that is the Archimedes palimpsest; investigators used spectral imaging to unravel an important text, revealing a previously unknown book of Archimedes (see www.archimedespalimpsest.org). Another example is the large collection of palimpsests at St. Catherine's Monastery in the Sinai, being imaged under a long-term project (http://emel-library.org).
Spectral imaging is capable of much more than just reading texts. Most systems are not radiometrically calibrated in use since the goal is to simply apply imaging-classification methods with data from each session, rather than across a large database. For example, principal-component analysis (PCA) and spectral classification work well on raw data to reveal text. PCA really does not care since it is a statistical method and one can always pick out local spectral features such as endmembers (spectrally pure features) by hand for each image cube. However, a calibrated image cube opens up new possibilities.
Unified image sets
For example, many texts are scattered in parts among different institutions; the only way to create a unified image set is with calibrated cubes. Calibration means that the journal literature can create a database of inks, pigments, substrates, and other components to be used for classification and analysis. Perhaps the most-interesting application of calibrated spectral data is to use it to monitor objects for changes over time.
It is conceptually simple: for example, one images in January and June and then compares. There is a large-scale, ongoing project doing just that: the Leon Levy Digital Dead Sea Scrolls Library (www.deadseascrolls.org.il) is doing 12-band high-resolution imaging of the scrolls and posting the images online. The major impetus of the project was conservation monitoring using calibrated cubes and a set of problematic fragments repeatedly imaged over time.
Quantitative imaging, as a tool for conservation monitoring, requires both a well-calibrated system and a software approach to detecting and quantifying change. It is critical to have a repeatable system since this sets the threshold for detectable change. For this application, we need precision over accuracy to make the system sensitive to change in the object. The measuring approach used by the scroll project for monitoring borrowed from quality assurance and process-control Shewart charts. It can automatically interrogate an entire image, flag pixels as changed, and has user-defined statistical thresholds for analysis.2
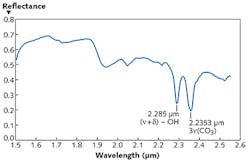
SWIR imaging offers a new spectral range for imaging of cultural heritage and is especially interesting, as it provides chemical information with many uses. While VNIR imaging can separate some pigments, many similar colors are easier to cleanly separate in SWIR. The SWIR range out to 2500 nm can provide information on pigment mineralogy, lipids, and organics binders in pigments, as well as tannins and other chemicals used to process substrates.REFERENCES
1. G. H. Bearman and S. I. Spiro, "Archaeological applications of advanced imaging techniques," Biblical Archaeologist, 59, 56 (1996).
2. E. Marengo et al., Anal. Chim. Acta, 706, 229 (2011); http://dx.doi.org/10.1016/j.aca.2011.08.045.
Greg Bearman is at ANE Image, Pasadena, CA, and Christopher Van Veen is at Headwall Photonics, Fitchburg, MA; e-mail: [email protected]; www.headwallphotonics.com.


