Spectroscopy: Raman spectroscopy advances for biomedical applications

MARINELLA G. SANDROS and FRAN ADAR
Life scientists working in basic and clinical research are attracted to Raman spectroscopy for a number of reasons. Among these are the facts that the technique involves minimal water contribution, and enables label-free measurements and imaging/identification of biological samples. Over the past decade or so, new advancements in Raman spectroscopy have facilitated a number of unique biomedical applications, including medical diagnostics, cell sorting methods, and biotherapeutic development.
Revealing droplet formation process
A mouse study designed to provide insights into lifestyle diseases such as atherosclerosis, heart disease, diabetes, hypertension, and liver disease demonstrated the usefulness of Raman spectroscopy.1 Such diseases often involve dysfunction of the endothelium (the exposed layer of the interior of an artery) and lipid droplets (LDs) ranging in size from 20 to 100 nm, which may be implicated in inflammatory disease. The researchers used Raman to characterize intracellular lipid distribution in three categories of livers: normal, sclerotic (stiffened), and diabetic, and found that the lipid composition of the livers reflected the animals' diet—a mouse fed a high-fat diet, together with drugs (metformin and perlindapil), exhibited increased saturation.
The team reported that Raman spectroscopy enabled them to detect, for the first time, the process of LD formation in the endothelium in 3D, and also to determine the size, origin, and composition of different droplets. The team concluded that Raman has potential as "a valuable tool for studying the role of LDs in physiology and pathology."
Differentiating variants
Raman spectroscopy has proven useful in differentiating between variants of disease and bacteria that are visually indistinguishable. For instance, while systemic inflammatory response syndrome (SIRS) most commonly results from an infection caused by bacteria or other pathogens in the blood (and in this case is called sepsis), in certain cases it is caused by noninfectious conditions like severe trauma or invasive surgical procedures. The ability to identify and stratify patients is critical for timely and appropriate treatment, but currently there is no reliable biomarker for distinguishing between these two etiologies.
In a study involving 70 patients (about half with each type of the disease), direct visual inspection of the average Raman spectrum of 5 μL of blood plasma dried on a CaF2 slide could not distinguish between sepsis and noninfectious SIRS (see Fig. 1), but analysis of the Raman data with multivariate analysis did.2
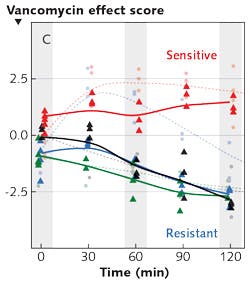
Another challenge in diagnostics is distinguishing between enterococci (intestinal flora) that are sensitive to vancomycin (the antibiotic commonly used to treat such bacterial infections) and those that are resistant to it. The identification of vancomycin-resistant enterococci (VRE) is necessary for effective treatment and containment of disease transmission. It is well known that in resistant strains, a terminal alanine (amino acid) on a cell wall protein has been changed to lactate (a sugar), and this change prevents vancomycin from binding. In a recent study, researchers used dielectrophoresis to capture bacteria from dilute suspensions, and used Raman spectroscopy to analyze them over the course of two hours—with and without antibiotics. The researchers recorded characteristic differences in the molecular response of the sensitive and resistant bacteria: changes in their spectra at 1250, 1500, and 2850 cm-1 provide information producing a "vancomycin score."3 In a study that plotted the vancomycin score as a function of time, it was evident that within two hours, the score of the resistant strain dropped, while the score of the sensitive strain remained higher (see Fig. 2). The researchers note that the method worked, even for identifying the status of a strain that was not used to develop the model.Another study measured the spectra of cells infected with S. aureus bacteria. It is established that in chronic infections, these bacteria are sequestered in infected cells. However, what was not known was whether the sequestered bacteria are different from extracellular bacteria. In fact, the scores did separate intracellular from extracellular bacteria, presumably because there is a change in gene expression. As an application of this, a good separation between infected vs. non-infected leukocytes was demonstrated.
Advanced cell sorting
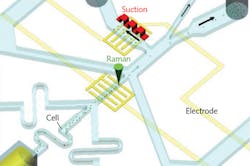
Raman activated cell sorting (RACS), an exciting new tool, enables biologists to study cell phenotypic variation—potentially in situ. The label-free approach can serve as a complementary technique to fluorescence-activated cell sorting (FACS, the conventional method requiring fluorescent labels), adding global information on the biochemical and metabolic makeup of an individual cell.4 Single-cell interrogation by RACS can be realized by integrating Raman tweezers (in solution), with microfluidics (in flow) or Raman-activated cell ejection (RACE, on a surface; see Fig. 2).5 Researchers have demonstrated that such advances as stimulated Raman scattering and pre-screening can increase RACS sorting speed. Further, pattern recognition methods can help characterize single-cell Raman spectra, and it is possible to extract specific Raman bands as biomarkers for RACS. Cell sorting developments based on microfluidics and RACE have been shown to improve accuracy and reliability in complex samples.
While the inherent weakness of the spontaneous Raman signal has limited RACS' ability to identify single cells in a high-speed flow, new research has studied an alternative pause-and-sort RACS microfluidic system. The setup integrates trapping, Raman identification, and automatic separation of individual cells by combining positive dielectrophoresis (pDEP, for single-cell trap and release) with a solenoid-valve-suction-based switch (for cell separation). The research team exerted a periodical pDEP field to trap, order, and position cells individually, enabling Raman measurement at the subsecond level. It is foreseeable that such emerging Raman-based technology, in combination with high-throughput sorting technology, can enable the selection of cells with specific phenotypes for downstream single-cell sequencing.6
Another example of Raman spectroscopy's versatility in combination with multivariate analysis is for the characterization of therapeutic agents. Scientists use Raman to monitor drug distribution and cellular response in real time for the purposes of early-stage drug development, and also to assess cellular health, as the presence of toxins significantly modifies the Raman fingerprint of a single cell.7,8
The tip-enhanced Raman scattering (TERS) technique, which combines atomic force microscopy with surface-enhanced Raman, has been found helpful in providing information on the spatial scale of many organelles. For example, researchers used TERS to resolve the difference between native and glycosylated forms of several proteins.9 Current efforts are focused on advancing the technology to be able to follow glycosylation of a single protein.
Lastly, scientists working to develop antibodies are looking to Raman as a sensitive tool to monitor protein stability in solution. Researchers combined Raman with two-dimensional perturbation-correlation moving window (PCMW) spectroscopy to shed light on protein aggregation, which is essential for antibody engineering.10 They compared five antibodies with varying propensity to aggregate, using a 532 nm excitation wavelength to acquire Raman spectra as they heated the protein samples from 56° to 78°C. "Initial principal component analysis confirmed a trend between the observed spectral variations and increasing temperature for all five samples," the researchers reported. "Analysis using PCMW revealed that when spectral variations were directly related to temperature, distinct differences in conformational changes could be determined between samples related to protein stability," which provided a greater understanding of aggregation mechanisms.
The biological toolbox is growing, thanks to great advancement in Raman-based systems and sophisticated analysis software. As more scientists realize the unique capabilities of Raman spectroscopy for analyzing complicated samples such as cells and tissues, we expect that great discoveries and advancements in the biomedical field will occur at a faster rate.
REFERENCES
1. K. Majzner, Anal. Chem., 86, 13, 6666−6674 (2014).
2. U. Neugebauer, J. Biophoton., 7, 3−4, 232−240 (2014).
3. U. C. Schröder et al., Sci. Rep., 5, 8217 (2015).
4. J. Perkel, The Scientist, 6, 59 (2015).
5. Y. Song, Curr. Opin. Chem. Biol., 33, 1−8 (2016).
6. P. Zhang, Anal. Chem., 87, 2282−2289 (2015).
7. R. Smith et al., Analyst, 141, 3590 (2016).
8. A. Zoladek et al., J. Raman Spectrosc., 42, 251−258 (2011).
9. D. Cowcher et al., Anal. Chem., 88, 2105−2112 (2016).
10. R. De La Cuesta, Anal. Chem., 86, 11133−11140 (2014).
Marinella G. Sandros is business development manager for life sciences and SPRi product manager, and Fran Adar is worldwide Raman applications manager, both at Horiba Scientific, Edison, NJ; e-mail: [email protected]; www.horiba.com.
