FIBER-OPTICS TEST & MEASUREMENT: Rayleigh backscatter reflectometry boosts fiber characterization
DAWN K. GIFFORD
Optical backscatter reflectometers (OBRs) have allowed researchers, design engineers, and test engineers to look into their fiber-optic components or assemblies in a way that was not possible prior to their introduction in 2004. The high sensitivity (-130 dB) and fine spatial resolution (10 µm) of the OBR measurement enables a user to see inside a device under test to locate each individual element of an assembly or component and determine if it is working according to design.
Faults and failures can be readily identified and the return loss and insertion loss of each element characterized, improving the overall quality control (QC) process. In addition, the precise measurement of the Rayleigh scatter of optical fiber provided by the OBR makes it possible to see and characterize fiber-optic phenomena that were previously invisible.
OBR measurement capabilities
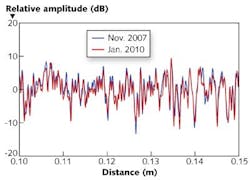
There has been some debate in the fiber-optic community whether or not the Rayleigh scatter pattern in a fiber is a permanent feature of that fiber. Through measurements made over several years using OBRs, Luna has been able to determine that the Rayleigh scatter pattern of fiber remains repeatable and unique (see Fig. 1).
Using OBR technology, the same SMF-28 fiber spool was measured with two different OBR instruments at times more than three years apart. The first measurement was taken in November of 2007 and the second was taken in January of 2010 and the data have been offset to center around zero. One can clearly see the repeatable pattern in the reflected amplitude in these two measurements.
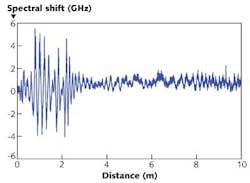
Further analysis of the two datasets showed a spectral shift between the measurements of about 18 GHz, or 0.14 nm. A few picometers of this shift could be due to wavelength error in the measurement. The rest is likely the result of temperature difference in the fiber when the measurements were taken. Using a common scale factor of +0.8°C per gigahertz, this would imply a temperature difference between the two measurements of about +14°C.1 After accounting for this overall spectral offset, we calculated the residual spectral difference between the two datasets using proprietary phase-tracking comparison techniques that show the residual spectral shift along a 10 m segment of the fiber spool.2
First we should recognize that if the fiber scatter pattern were not consistent between the two datasets, the phase-tracking technique would not work but would just produce noise. Simply getting meaningful results from the phase-tracking algorithm implies that there is excellent correlation between the measurements. The results show a maximum spectral shift of a little less than 6 GHz, with a periodic feature visible in the dataset, especially in the first few meters (see Fig. 2). This period corresponds directly to the 2.5 in. diameter of the fiber spool, implying a temperature or strain variation from one side of the spool to the other. A 6 GHz shift corresponds to about +5°C or 40 microstrain.Both the amplitude comparison and the distributed spectral comparison indicate excellent correlation between the two measurements. This illustrates that the Rayleigh scatter pattern of the fiber remains a unique and repeatable characteristic over a span of more than 3 years—a unique natural characteristic of optical fiber that enables Rayleigh-scatter-based distributed sensing and also unique identification of individual fibers.3, 4
Identifying fiber sections in a network
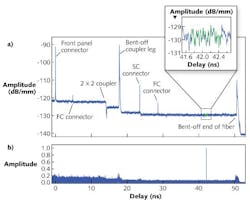
To illustrate the ability to uniquely identify a section of fiber using OBR, we measured a fiber segment before and after splicing it into a simple fiber network. The reflected amplitude vs. delay of this fiber segment was measured before and after the splice into the sample network, consisting of several connectors and a 2 × 2 coupler (the measured amplitude of the segment before and after splicing into the network match very well). A cross-correlation between the two datasets allows a unique identification of the location of the fiber segment within the network as indicated by a correlation peak in the measurement data (see Fig. 3).The sensitivity, accuracy, and spatial resolution of the OBR that enable repeatable measurements of the Rayleigh scatter amplitude and phase patterns of a fiber also enable clear identification of fiber components. Connectors are visible as sharp, clearly defined peaks within the network, where a bent-off termination appears as a wide peak, causing a drop in Rayleigh scatter or an insertion loss in the network. Without high spatial resolution, the bend would be indistinguishable from the connectors.
Finally, a 2 × 2 coupler signature is identified within the network as a sharp decrease in amplitude before recovering back to the nominal insertion loss value. The high spatial resolution of the measurement shows the unique drop in scatter level seen at the midpoint of fused tapered couplers. Without this feature, the loss due to the coupler would be indistinguishable from a bad splice. To the best of our knowledge, this signature feature of tapered fiber couplers was unknown previous to the advent of the OBR.
Monitoring fiber changes
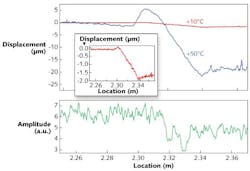
High-resolution measurement of the Rayleigh scatter signature of a fiber or fiber component also allows fine-level determination of changes that occur within that fiber or component under various conditions. For example, fiber-optic couplers are designed to have low response to thermal changes. We measured a coupler at temperatures varying from -20° to +50°C. The temperature variation causes small changes in the fiber length (displacements) within the coupler (see Fig. 4).To determine the coupler temperature characteristics, we measured the shift in the Rayleigh scatter pattern at +10°C and +50°C as compared to a baseline scatter pattern at -20°C. In general, an increase in temperature causes the fiber to lengthen, leading to an overall linearly sloping displacement as a function of distance. Locally, however, there can be small changes in this displacement slope due to coefficient of thermal expansion (CTE) mismatch within a component.
These length changes with respect to the fiber length at -20°C were then plotted, with the overall displacement slope of the fiber due to the increase in temperature subtracted out. The scatter amplitude of the coupler over the same region shows a dip commonly seen in the taper region of a coupler, which corresponds to a 20 µm compression at +50°C relative to the overall expansion of the fiber due to the temperature change from -20° to +50°C. But at +10°C, the relative compression is only 2 µm, indicating that this coupler is well designed to have a good CTE match and low response to thermal changes.
These examples illustrate how fiber-optic phenomena can be measured using OBR technology, improving component QC testing and the design verification process. Other examples include measuring the beat length in a polarization-maintaining (PM) fiber, measuring the dispersion group delay (DGD) of a PM fiber assembly as a function of length, measuring temperature changes inside a component, and sensing distributed strain and temperature for structural test and industrial applications.5-9 This same OBR technology is also the basis of fiber-optic shape sensing—measuring the shape of a multicore fiber by measuring the strain in each core—that has many exciting potential applications including minimally invasive surgery.
REFERENCES
1. A. Othonos and K. Kalli, Fiber Bragg Gratings: Fundamentals and Applications in Telecommunications and Sensing, Artech House, Boston, MA (1999).
2. D.K. Gifford, M.E. Froggatt, and S.T. Kreger, “High precision, high sensitivity distributed displacement and temperature measurements using OFDR-based phase tracking,” Proc. SPIE, 7753, 77533I–77533I-4 (2011).
3. B. Soller et al., 2006 Optical Fiber Communication (OFC) and the National Fiber Optic Engineers Conference (NFOEC), paper OFN 3, Anaheim, CA (March 2006).
4. M. Froggatt et al., “Correlation and keying of Rayleigh scatter for loss and temperature sensing in parallel optical networks,” 2004 OFC Postdeadline Papers, Volume 2, Los Angeles, CA (2004).
5. D.K. Gifford et al., 2007 OFC/NFOEC, paper JWA8, San Diego, CA (March 2007).
6. M.E. Froggatt et al., J. Lightwave Technol., 24, 4149–4154 (November 2006).
7. A. Guemes, A. Fernandez-Lopez, and B. Soller, Structural Health Monitoring, 9, 3, 233–245 (May 2010).
8. S. Klute et al., “Defect Detection During Manufacture of Composite Wind Turbine Blade With Embedded Fiber Optic Distributed Strain Sensor,” 43rd ISTC, Fort Worth, TX (October 2011); www.sampe.org/store/paper.aspx?pid=6661.
9. A.K. Sang et al., IEEE Sensors Journal, 8, 7, 1375–1380 (2008).
Dawn K. Gifford is director of technology development at Luna Innovations Inc., 3157 State St., Blacksburg, VA 24060; e-mail: [email protected]; www.lunainnovations.com.


