Photonics Applied: Terrestrial Imaging: Spectral imaging satellites monitor global vegetation health
The 2013/2014 season brought floods to Europe and plunged the eastern United States into a "polar vortex" winter, all while the western U.S. continued to suffer through a serious drought. Because such severe weather patterns have serious impacts on croplands and forest cover, aircraft- and satellite-based imaging systems are being increasingly deployed to monitor soil and vegetation health.
The National Oceanic and Atmospheric Administration (NOAA; Silver Spring, MD) and Satellite Imaging Corporation (Magnolia, TX) take advantage of satellite data to publish several types of green vegetation and drought indices. They are among numerous other institutions recognizing the importance of multispectral measurement data to monitor and understand global vegetation health with high-resolution imagery. Although real-time data processing is not yet possible, deployment of miniaturized satellite designs promise faster data streams and broader data access.
Please note that while light detection and ranging (lidar) technology is also playing an increasingly important role in vegetation monitoring and forest canopy studies, this article limits the equipment discussion to airborne and satellite-based multispectral imagers.
Mapping and monitoring vegetation health
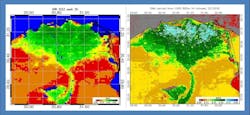
To create its global Vegetation Health Index (VHI) maps, which are updated each week, NOAA relies on an image-processing algorithm to convert satellite imaging data to color-coded vegetation health data (see Fig. 1). The VHI index ranges from 0 to 100, characterizing changes in vegetation conditions from extremely poor (0) to excellent (100); fair conditions are coded by green colors (around 50) that change to browns and reds when conditions deteriorate (below 40 is a vegetation stress or indirect drought indicator) and to blues when they improve.
Reflecting a combination of chlorophyll and moisture content and changes in thermal conditions at the surface, the index uses an algorithm (see http://1.usa.gov/1i0HIr6) that combines visible light (VIS), near-infrared radiation (NIR), and thermal infrared radiation (TIR) radiance data from the advanced very high resolution radiometer (AVHRR) aboard the NASA-provided NOAA-19 polar-orbiting satellite.
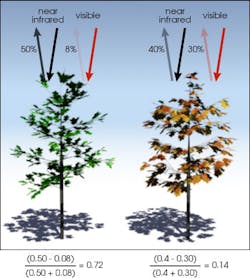
Gathered in six spectral bands having wavelengths from 580–680, 725–1100, and 1580–1640 nm (VIS and NIR) as well as 3.55–3.93, 10.3–11.3, and 11.5–12.5 μm (TIR), the AVHRR VIS and NIR values are first converted to a Normalized Difference Vegetation Index or NDVI = (NIR-VIS)/(NIR+VIS) and the TIR values to brightness temperature (BT) values using a lookup table. Essentially, healthy vegetation that has high chlorophyll content and high biomass density absorbs most of the visible light that strikes its surface and reflects most of the NIR radiation due to a robust cell structure in the leaves and the lack of chlorophyll absorption, while unhealthy or sparse vegetation reflects more visible light and less NIR radiation (see Fig. 2).1The NDVI and BT values are filtered in order to eliminate high-frequency noise and adjusted for non-uniformity of the land surface due to climate and ecosystem differences. The VIS and NIR data are pre- and post-launch corrected, and BT data are adjusted for nonlinear behavior of the NIR channel. These NDVI and BT values are then converted to the VHI values through a series of calculations that factor in historical averages (AVHRR data has been collected continuously since 1981) for the same time period.
While the AVHRR instrument gathers imaging data in six wavelength bands at 1 km spatial resolution, NOAA's Visible Infrared Imager Radiometer Suite (VIIRS)—launched in 2011—gathers imagery at 375 m resolution in 22 bands from 412 nm to 12 μm for more complete spectral coverage with increased radiometric quality (see Fig. 3). As vegetation health maps continue to improve in quality, associated malaria threat maps, drought maps, and even crop-yield maps derived from the vegetation data likewise benefit from increased spatial resolution, accuracy, and more frequent revisits over time.AgroWatch, other algorithms
For the individual farmer or for other forestry, mining, or real-estate development companies, more "personalized" vegetation maps require spatial resolutions on the order of 15 m or smaller pixels. To fill this need, DigitalGlobe's (Longmont, CO) AgroWatch product is a color-coded Green Vegetation Index (GVI) map that has indicator values from 0 (for no vegetation) to 100 (for the densest vegetation). These GVI values are calibrated using specific crop information and based on custom spectral algorithms that are less affected by variations caused by underlying soils or water.
The GVI allows users to accurately correlate their crop cover with industry standard vegetation measurements including the Green Leaf Area Index, plant height, biomass density, or percent canopy cover. In essence, GVI maps play the role of historic and still-used NDVI maps, but without the "soil noise" influence that plagues NDVI values.
"Since the original NDVI formula was devised back in the 1970s for Landsat 1 data, there are now dozens of NDVI-like formulas with myriads of spectral adjustment algorithms," says Jack Paris, president of Paris Geospatial, LLC (Clovis, CA). With 47 years of experience in remote-sensing with NASA (JSC and JPL), Lockheed, DigitalGlobe, and several universities, Paris also developed numerous improved NDVI algorithms for companies like C3 Consulting LLC (Madison, WI), which is now a division of Trimble (Sunnyvale, CA), a provider of commercial solutions that combine global expertise in GPS, laser, optical, and inertial technologies with application software and wireless communications.
"My information-extraction algorithms for C3 called PurePixel can produce vegetation and soil maps that take into account several crop characteristics," says Paris. "C3 also collects dozens of soil characteristics in the field that often correlate well with vegetation and soil conditions that come from aircraft-based or satellite-based images." Paris adds, "In the 1980s, Dr. Alfredo Huete conducted experiments with rows of potted plants over a variety of light- and dark-colored [dry and moist soils]. He found that these kinds of soil variations influenced the surrounding vegetation's reflectance values and caused classic NDVI values to be affected [the "soil noise" mentioned earlier]. This is just one example of why it is extremely important to address imaging anomalies when analyzing multispectral imagery so that vegetation vigor and health data can be accurately mapped and monitored."
One such anomaly that greatly impacts how the farmer interprets localized crop information is the positional error induced by satellite imagery due to the fact that image data is skewed by the angle of the sensor and the sheer swath of land mass captured by the sensor at non-perpendicular angles—not to mention variations due to terrain unevenness. To correct these imaging errors so that a farmer knows which rows of corn might require more fertilizer, for example, companies like Satellite Imaging Corporation offer orthorectification (see http://1.usa.gov/1i0HIr6) services to produce vegetation maps that overlay accurately to ground-based terrain maps.
Orthorectification is a process where the natural variations in the terrain and the angle of the image are taken into consideration and, by using geometric processes, are compensated for to create an image that has an accurate scale throughout. Satellite Imaging Corporation says that if satellite sensors acquire image data over an area with a kilometer of vertical relief and the sensor has an elevation angle of 60° (30° from the perpendicular from the satellite to ground), the image will have nearly 600 m of terrain displacement. To accurately remove image distortions, a digital elevation model (DEM) is used to perform orthorectification via feature extraction by both high-resolution stereo satellites like GeoEye-1, the Worldview and Pleiades series, IKONOS, or ASTER, as well as through stereo aerial photography images.
Drought and ice maps
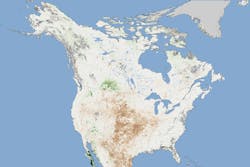
Among the information found at the U.S. Drought Portal (www.drought.gov) is a drought map produced each week by a by a rotating group of authors from the U.S. Department of Agriculture, NOAA, and the National Drought Mitigation Center. The National Aeronautics and Space Administration (NASA) also produce drought maps using NDVI data from the moderate resolution imaging spectroradiometer (MODIS) aboard NASA's Terra and Aqua satellites. A recent map contrasts plant health in August 2012 against the average conditions between 2002 and 2012 (see Fig. 4)."By far, this is the driest year we have seen since the launch of MODIS [in 1999]," said Molly Brown, a vegetation and food security researcher at NASA's Goddard Space Flight Center. Terra MODIS and Aqua MODIS view the entire Earth every one to two days, acquiring data at a peak 10.6 Mbit/s data rate in 36 spectral bands with spatial resolution that varies from 250 to 1000 m (depending on the spectral band). In addition to the VIS and NIR bands providing inputs to vegetation health, these and other spectral bands can monitor ice coverage as well.
"Multispectral information can be used to study ice and melting processes; the underlying physics is that snow and ice respond differently at different wavelengths," says Marco Tedesco, director of the Cryospheric Processes Laboratory at the City College of New York (New York, NY).2 "For example, multispectral data can separate snow from ice by combining both visible and infrared data. Dirty snow can look like ice if we use only the visible, but using other wavelengths increases our confidence in the results-important because ice melts faster than snow and liquid water can flow faster over ice than over snow, with important implications in glacial melting studies." Tedesco continues, "We can also use multispectral data to separate between 'new' snow, which is spectrally very bright, and 'old' snow, which has undergone several melting/refreezing cycles and absorbs more solar radiation-further increasing warming and melting."
Next-generation satellite imaging
Commercial satellites are primarily manufactured by six major firms including Boeing, Lockheed Martin, Thales Alenia Space, and Astrium Satellites. Multispectral data is gathered by sophisticated instrumentation riding on multibillion-dollar, meter-resolution-capable commercial satellites weighing thousands of kilograms. But like everything else in the photonics industry, miniaturization is rapidly changing the way that future satellite imagery will be obtained.
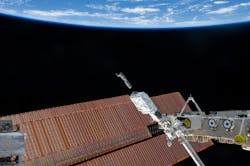
In December 2013, the first images and video were released from the 100 kg (minifridge-sized) Skybox Imaging (Mountain View, CA) satellite. And by this time, Planet Labs (San Francisco, CA) had already launched four satellites. By February 2014, the first of 28 total phone-book-sized (10 × 10 × 34 cm) Planet Labs' 'Dove' satellites comprising Flock 1 were launched from the International Space Station—representing the largest constellation of Earth imaging satellites ever launched (see Fig. 5). Flying at altitudes of roughly 500 km vs. 1000 km for traditional satellites, these micro-satellites will allow startups Skybox and Planet Labs to supply nearly real-time, comparable- or higher-resolution imaging data to a broader audience at reportedly lower prices than legacy satellite image providers.3Customers can access the Skybox satellite video stream as quickly as 20 minutes after imagery is obtained by purchasing a SkyNode terminal—a 2.4 m satellite communications antenna and two racks of electronics. While much of the terabyte-per-day data is processed directly onboard the satellite (whose circuitry consumes less energy than a 100 W light bulb), open-source software like Hadoop from Apache Software Foundation (www.apache.org) lets customers use Skybox data-processing algorithms or allows them to integrate their own custom algorithms in their SkyNode terminal.
Skybox's SkySat-1 collects imagery using five channels: blue, green, red, NIR, and panchromatic (all resampled to 2 m resolution in compliance with their NOAA license). And just like NOAA, Skybox is producing customized algorithms for mapping and monitoring vegetation health: the Modified Soil Adjusted Vegetation Index (MSAVI) from Skybox takes the NDVI metric one step further by correcting for the amount of exposed soil in each pixel in agricultural areas where vegetation is surrounded by exposed soil.
"Small satellites from Skybox Imaging and Planet Labs will revolutionize global vegetation health mapping and monitoring by enabling not just big corporations, but even the family farmer to access sub-meter-resolution imagery as quickly as crops grow," says Jack Paris. In addition to micro-satellite data, Paris is still waiting for public access to drone-based imagery in the U.S., which can be collected at centimeter-level spatial resolutions. "Drone data, along with data from satellites and manned aircraft, will really open some doors and allow for better management of farmland with more efficient use of precious resources such as water, pesticides, and fertilizers with increased yields—a win-win situation for everyone!"
REFERENCES
1. See http://1.usa.gov/NSiWir.
2. See http://1.usa.gov/1i59CTr.
3. See http://bit.ly/1btbpPq.
About the Author

Gail Overton
Senior Editor (2004-2020)
Gail has more than 30 years of engineering, marketing, product management, and editorial experience in the photonics and optical communications industry. Before joining the staff at Laser Focus World in 2004, she held many product management and product marketing roles in the fiber-optics industry, most notably at Hughes (El Segundo, CA), GTE Labs (Waltham, MA), Corning (Corning, NY), Photon Kinetics (Beaverton, OR), and Newport Corporation (Irvine, CA). During her marketing career, Gail published articles in WDM Solutions and Sensors magazine and traveled internationally to conduct product and sales training. Gail received her BS degree in physics, with an emphasis in optics, from San Diego State University in San Diego, CA in May 1986.


