FLUORESCENCE MICROSCOPY/QUANTITATIVE IMAGING: A systems-engineering approach to quantitative fluorescence bioimaging
Enter any microbiology or bioimaging lab, and you'll find shelves and drawers full of fluorescent dyes and fluorescence filter sets. In the cabinets, you may find mercury arc or metal halide lamps, light-emitting diodes (LEDs), or lasers. And on the workbench, of course, is the microscope with its camera and set of objective lenses, the workhorse that brings everything into focus. All one needs to do is pick a dye to stain the specimen of the day, match it with the recommended filter set from the manufacturer, plug in the lamp on the microscope, and in no time dazzling fluorescent images of microtubules and golgi apparati appear.
But what if instead of a beautiful image, one needs a quantitative result? What if the images are of simple beads, micro capillaries, or gels; and the point of the image is to detect the concentration of a particular biomolecules trapped within them?
The concentration of fluorescent markers can be a very important result, as known biomarkers can alert doctors to impending heart failure, early onset of cancer, or the early stages of a deadly infection.1,2 Even when these biomolecules are present at concentrations that would worry a physician, they might barely light up under a fluorescence microscope. For these applications, a quantitative image is more important than a qualitative one, and the basic recommendations for filters, sources, and dyes might not be enough. One needs a complete systems engineering approach.
Three key factors
The three factors that influence the quality of quantitative fluorescence imaging are fluorescence signal, camera noise, and background light (see Table 1). For many clinical assays, the presence of a fluorescence signal indicates the presence of disease and the amount of fluorescence indicates how sick a patient is. Camera noise makes a diagnosis less accurate. And background light makes a signal less precise. It is therefore important to know what contributes to signal, noise, and background in a quantitative fluorescence image.It is perhaps easiest to understand where signal comes from. Light shines through an excitation filter and reflects off of a dichroic filter through the objective and onto the specimen. This is the illumination. The dye within the specimen absorbs some of the light and converts most of it to a longer wavelength, which is then emitted. This emitted light is collected by the objective and imaged onto the camera. The amount of signal detected is proportional to characteristics of the illumination, dye, and imaging subsystems. So although signal is conceptually easy to understand, it is influenced by many factors.
Irradiance is the brightness of the source at the excitation wavelength. Numerical aperture (NA) determines how much of the excitation light is concentrated on the sample, and how much fluorescence is collected. And the extinction coefficient of a dye tells how strongly it absorbs, while its quantum yield determines how much absorbed light is emitted as fluorescence signal (these two factors determine the "brightness" of a dye). Finally, integration time is how long the camera is exposed for each image or frame.
Camera noise might not be as easy to understand, but it is usually easier to quantify. It is divided into three categories: dark noise, read noise, and shot noise. Most scientific cameras have very little dark and read noise, which leaves shot noise as the key source. Shot noise occurs because light travels in discrete packets called photons, which arrive at the camera in a steady (yet random) stream. Shot noise is proportional to the square root of the average rate of photons hitting the camera, regardless of whether they are signal photons or background photons. In other words, if the amount of fluorescence signal is F and the amount of background light is B, then the shot noise is sqrt(F + B).3 So it turns out that background not only decreases precision, but it also increases noise-which in turn decreases accuracy. Without background, SNR is always sqrt(F). So although noise increases along with either signal or background, it is best to generate as much fluorescence as the camera can detect.
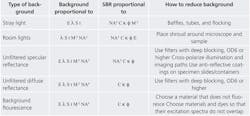
Unlike signal and noise, which both have a single source, background light can come from many sources (see Table 2). In a poorly constructed microscope, stray light from the source can bounce around filters and reach the sensor without ever passing through the specimen. In addition, some light always passes through the excitation filter, reflects off the specimen without fluorescing, and makes it through the emission filter. These reflections can be either diffuse or specular. Light from the overhead lighting can also reflect off the specimen and into the microscope. Finally, materials in the devices that contain the specimen can also fluoresce (this is called background fluorescence). Many of the same factors that affect the amount of fluorescence signal detected also affect the amount of background light detected.
One can increase the signal-to-background ratio (SBR), with two different approaches. One is to optimize system parameters for the highest SBR, and the other is to eliminate background. Table 2 shows the types of background encountered in fluorescence microscopy, the variables that affect the SBR, and the steps that can be taken to reduce or eliminate each type of background.Optimizing parameters
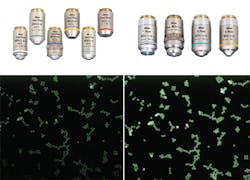
Of all the factors, dye has the most pronounced effect on SBR, so it should be addressed first. The best dyes are those that absorb the greatest number of excitation photons and convert as many as possible to emission photons. The second most influential variable is microscope NA. This may seem obvious, except that in reflectance microscopy, increasing the NA does not actually increase SBR. This is because both the signal and background become brighter. In fluorescence microscopy, though, NA has a greater effect on signal than on background, so increasing NA does increase SBR. The tradeoff for the system is that magnification tends to depend on NA. For objectives with 1–10x magnification, the ratio of NA to magnification (NA/M) is typically between 0.025 and 0.03. Some microscopes, like the Nikon Super Fluor series (see Frontis), have an NA/M ratio of 0.05. When options like these are available and within budget, increasing NA without increasing magnification is always preferable. The last system parameter that needs consideration is the light source. Long exposure times can amplify light from a dim source, but will also amplify any room light that leaks into the microscope. A bright source, such as Prior Scientific's Lumen 200, can avoid this.
Eliminating background
If eliminating background light is the preferred approach, then stray light must be the first priority. Stray light sometimes finds a path from the source to the camera without ever passing through filters or reaching the sample. This is not typically a problem in commercial microscopes, but can be very problematic in cage system microscopes. Baffles and tubes can be used to obstruct these paths, and flocking paper can be used to make tubes in a microscope less reflective. Baffles, tubes, and flocking are very effective in eliminating stray light. Background fluorescence can also be a major problem when using plastic devices to hold dyes. Just as it is important to choose a dye that fluoresces brightly, it is also important to choose a material to hold the sample that does not fluoresce brightly. If there is no alternative, the next step is to ensure that the material and the dye do not fluoresce at the same excitation wavelength. Other important steps to reduce background light include shrouding the sample and microscope to keep room lights out, and using deep blocking filters to eliminate diffuse and specular reflections of source light from the sample. Reflections can also be eliminated by cross-polarizing the illumination and imaging paths or using antireflective coatings on the device that holds the sample.
Between the two approaches to boosting SBR, optimization of system parameters typically gives the greatest effect, while eliminating background is faster and more cost-effective. These approaches are not mutually exclusive, however, and the most demanding applications may require both.
A key link
In many diagnostic and biomedical research applications, fluorescent molecules are the key link between a biological process and the quantitative circuits inside a camera and computer system. Whether bound to target analytes by antibodies or cleaved by enzymes in a sample under inspection, fluorescent molecules provide the photons that are detected by CCD and CMOS sensors in many of today's lab-on-chip and microfluidic devices. In many cases, the intensity of the fluorescence is a direct measure of the concentration of a target of interest. The limit of detection of these targets depends on the ability of the digital fluorescence microscope to accurately measure a small fluorescence signal. Photons from a variety of other sources constantly obscure the signal. Unwanted photons can come from unfiltered reflections of the fluorescent excitation source, room lights or daylight, and auto-fluorescence of the chips and microfluidic channels. In addition to the background light, the fluorescence signal also competes with noise for detection.
Increasing both SBR and SNR is important for precisely and accurately detecting and quantifying the presence of biomolecules that indicate disease. The level of these biomolecules can be important for biomedical research, or may indicate the presence and severity of a disease in a patient. Thus, there is good reason to reduce SNR and SBR in quantitative fluorescence imaging microscopes.
REFERENCES
1. J. V. Jokerst et al., Biosens. Bioelectron., 3622–3629 (2010).
2. X. Yu et al., Biosens. Biolectron., 129–136 (2012).
3. F. A. Merchant and A. Periasamy, "Fluorescence Imaging," in Q. Wu, F. A. Merchant, & K. R. Castleman, Microscope Image Processing, 247–298, Academic Print, Burlington, MA, USA (2008).
About the Author
Brian McCall
Optical Engineer, Edmund Optics
Brian McCall is an optical engineer with Edmund Optics (Barrington, NJ).


