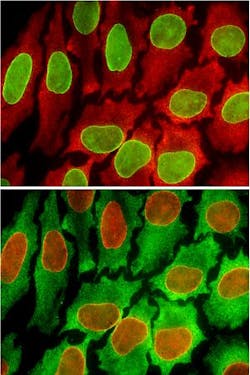
Quantum dots pinpoint 10X more biomarkers in cancer cells than before
A team of researchers at the University of Washington (UW; Seattle, WA) has turned to quantum dots for color-coding cancer cells, which allow them to illuminate 100 biomarkers. The discovery enables a 10-time increase from the current research standard to help analyze individual cells from cultures or tissue biopsies.
The research builds on current methods that use a smaller array of colors to point out a cellâs biomarkersâcharacteristics that indicate a potentially abnormal or diseased cell. Ideally, scientists would be able to test for a large number of biomarkers, then rely on the patterns that emerge from those tests to understand a cellâs properties.
Related: 'DNA origami' technology boosts labeling options for fluorescence microscopy
The research team has created a cycle process that allows scientists to test for up to 100 biomarkers in a single cell. The analysis uses quantum dots, which are the smaller version of the material found in many electronics, including smartphones and radios. The quantum dots are between 2 and 6 nm in diameter, and they vary on the color they emit depending on their size.
Cyclical testing hasnât been done before, though many quantum dot papers have tried to expand the number of biomarkers tested for in a single cell. This method essentially reuses the same tissue sample, testing for biomarkers in groups of 10 in each round.
âProteins are the building blocks for cell function and cell behavior, but their makeup in a cell is highly complex,â says corresponding author Xiaohu Gao, a UW associate professor of bioengineering. âYou need to look at a number of indicators (biomarkers) to know whatâs going on.â
In the method, Gao and his team purchase antibodies that are known to bind with the specific biomarkers they want to test for in a cell. They pair quantum dots with the antibodies in a fluid solution, and inject it onto a tissue sample. Then, they use a microscope to look for the presence of fluorescent colors in the cell. Particular quantum dot colors present in the tissue sample indicate that the corresponding biomarker is present in the cell.
After completing one cycle, Gao and co-author Pavel Zrazhevskiy, a UW postdoctoral associate in bioengineering, inject a low-pH fluid into the cell tissue that neutralizes the color fluorescence, essentially wiping the sample clean for the next round. Remarkably, the tissue sample doesnât degrade at all even after 10 such cycles, Gao says.
For cancer research and treatment, itâs important to be able to look at a single cell at high resolution to examine its details. For example, if 99 percent of cancer cells in a personâs body respond to a treatment drug, but 1 percent doesnât, itâs important to analyze and understand the molecular makeup of that 1 percent that responds differently.
The process is relatively low-cost and simple, and Gao hopes the procedure can be automated. He envisions a chamber to hold the tissue sample, and wire-thin pumps to inject and vacuum out fluid between cycles. A microscope underneath the chamber would take photos during each stage. All of the images would be quantified on a computer, where scientists and physicians could look at the intensity and prevalence of colors.
Gao hopes to collaborate with companies and other researchers to move toward an automated process and clinical use.
The work appears in Nature Communications; for more information, please visit http://www.nature.com/ncomms/journal/v4/n3/full/ncomms2635.html.
-----
Follow us on Twitter, 'like' us on Facebook, and join our group on LinkedIn
Subscribe now to BioOptics World magazine; it's free!


