‘Fast FLIM’ speeds imaging of fluorescence lifetime
Bert Van Geest and Ria Oosterveld-Hut
Fluorescence lifetime is the signature of a fluorescent material, used primarily for protein-protein interaction experiments like signal transduction studies, but also for pH measurements inside cells and other ion concentrations. It is the time constant of the exponential decay in emission after the excitation of a fluorescent material has been stopped. In other words, the fluorescence lifetime is the average time that fluorescent materials spend in their excited state.
Fluorescence-lifetime imaging microscopy (FLIM) maps the spatial distribution of these fluorescence lifetimes within microscopic images and it allows measurements in living cells as well as in fixed materials. By attaching a homodyne frequency-domain FLIM system to a conventional wide-field fluorescence microscope, lifetime images can be generated within seconds of acquisition time (see Fig. 1). This could be called “fast FLIM” compared to FLIM systems attached to confocal laser-scanning microscopes (CLSM), which are mostly time-domain systems. Using a time-domain CLSM system, image acquisition easily takes more than one minute per acquisition.
Fast FLIM has other advantages as well. It reduces the amount of time spent at the microscope. Researchers don’t have to wait long periods before the preliminary data appear, which makes the FLIM measurements convenient. In addition, with fast FLIM dynamic responses inside cells can be followed over time more easily, for example in signal transduction studies. The lifetime changes are shown as a 2-D movie (of, say, the complete cell) and also as average lifetimes of different regions of interest in a graph to show the exact lifetime change in time per organelle. The homodyne frequency-domain method also enables accurate FLIM measurements of moving cells that are migrating over the coverslip, a phenomenon that occurs in many cell-biology studies.
FLIM and FRET
Fluorescence lifetimes are independent of intensity changes inside the samples; thus no corrections are needed if there are concentration variations or if slight bleaching occurs during the measurements. However, some phenomena can affect fluorescence lifetimes, creating numerous applications of FLIM. Using the proper indicator fluorophores, FLIM can be used for ion imaging, oxygen imaging, probing microenvironment, and medical diagnosis.
The most powerful FLIM application in biology is the detection of fluorescence resonance energy transfer (FRET). FRET is a useful tool for quantifying molecular dynamics such as interactions of two proteins by fluorescence microscopy. FRET occurrence means that two selected fluorophores forming a FRET pair (donor and acceptor) that is tagged to the two proteins are in such close proximity that energy is transferred from donor to acceptor, which is the case if the two proteins do interact (as in signal transduction). “In close proximity” means that the two fluorophores are less than 9 nm apart—smaller than most proteins.
For FRET studies the proteins under investigation have to be labeled/tagged with donor fluorophores or acceptor fluorophores. Using the results of the energy transfer of these fluorophores, one can predict the interaction between the proteins of interest. The donor fluorophore is excited by the light source and will return from its excited state to the ground state by losing its energy through emission of a photon (fluorescence), or by transferring its energy nonradiatively to a nearby acceptor molecule (FRET). In the case of FRET, the donor has more options to lose its energy compared to a molecule that exhibits no FRET, such as if no acceptor fluorophores are present. Therefore, the donor fluorophore returns faster to the ground state, resulting in a decreased fluorescence lifetime.
For common fluorescent proteins, the fluorescence lifetimes are very short. Green fluorescent proteins (GFPs), for example, have a fluorescence lifetime of about 2.2 ns, which can decrease upon FRET with, say, a red fluorescent protein, to 1.9 ns, yielding a FRET efficiency of E = 1 – (τDA/τD) = 1 – (1.9/2.2) = 13.6%. Several published papers describe the choice or optimization of FRET pairs.1-4
The frequency-domain method has been used for diverse studies. One is the fundamental study on cystic fibrosis. In the airways of patients with CF, mutations in the CFTR gene (calcium channel protein) indirectly promote bacterial colonization and secondary infections. FLIM-FRET was applied to show FRET between CFTR (the CF transmembrane conductance regulator, also known as the chloride channel) and the ENaC (epidermal sodium channel) tagged to ECFP and EYFP, respectively.5 The use of FLIM is also described for cancer research; for example, Dr. K. Jalink’s group at the Division of Cell Biology of the Netherlands Cancer Institute (Amsterdam) is using frequency-domain FLIM as a quantitative method in its studies.6-8
LED-based FLIM
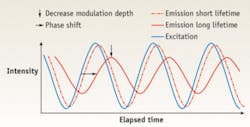
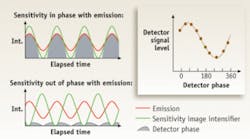
The LIFA (Lambert Instruments FLIM Attachment) is a frequency-domain FLIM system that can be attached to any conventional fluorescence wide-field microscope.9 It uses LEDs as the modulated light source and a modulated image intensifier fiber-optically coupled to the CCD camera as detector. The excitation light is modulated in intensity at a frequency up to 100 MHz, so the induced fluorescence emission will be intensity-modulated as well. Due to the decay of the emission, the emitted light will show a phase shift (delay in time) and a decrease in modulation depth (lower maximum intensity and higher minimum intensity than the excitation light, while the average intensity remains the same) with respect to the excitation light. This phase shift and decrease in modulation depth depend on the decay constants of the fluorescent material and the modulation frequency (see Fig. 2). The lifetime can be calculated from each of these two parameters.In some cases, wide-field microscopy is not sufficient to obtain valuable results, such as in membrane studies or when working with thick samples. For this reason the LIFA is compatible with other techniques, such as total-internal-reflection fluorescence (white-TIRF and laser-TIRF) and multibeam confocal microscopy. TIRF microscopy is an ideal method for studying fluorescently labeled proteins that are located at the periphery of a cell, for example, in the membrane, up to 100 nm from the coverslip. This is because the fluorescent proteins of deeper regions in the cell are not excited by the evanescent wave that is generated in a TIRF setup.
Multibeam confocal microscopy is used to increase micrograph contrast, but then at any focus plane in the cell (optical sectioning) by eliminating out-of-focus light in specimens that are thicker than the focal plane. It is also used to reconstruct 3-D images. The multibeam confocal technique can be obtained by using a Nipkow disk that has a spiral pattern of pinholes arranged to scan the specimen, with an array of light beams.
Of course there are more ways to detect FRET. One shouldn’t forget the ratiometric method making use of intensity changes of the donor as well as the acceptor fluorophores, or the acceptor photobleaching technique. However, by adding FLIM to these methods, researchers can be more certain in their conclusions of the FRET efficiencies. Moreover, the fluorescence lifetime does not change upon intensity variations, so the lifetime measurements are not dependent on the local concentration of fluorophores, the optical path of the microscope, the local excitation light intensity, or the local fluorescence detection efficiency.
REFERENCES
1. B. Domingo et al., Microsc. Res. Tech. 70 (12)1010 (2007).
2. J. Goedhart et al., PLoS ONE 2 (10) e1011 (2007).
3. E.M. Merzlyak et al., Nature Methods 4 (7) 555 (2007).
4. G.-J. Kremers et. al., Biochemistry 45 (21) 6570 (2006).
5. B.K. Berdiev et al., J. Biol. Chem. 282 (50) 36481 (2007).
6. J. Van Rheenen et al., The EMBO Journal 24 (9) 1664 (2005).
7. W. Zwart et al., Immunity 22 (2) 221 (2005).
8. B. Ponsioen et al., EMBO reports 5 (12) 1176 (2004).
9. L.K. van Geest et al., Lett. Peptide Science 10 (5-6) 501 (2003)
10. E.B. van Munster and T.W.J. Gadella. Advances in Biochem. Engineering/Biotechnology 95, 143 (2005).
11. A.D. Elder et al, J. Microscopy 224 (Pt2) 166 (2006).
12. A.D. Elder et al., Optics Express 14, 5456 (2006).
BERT VAN GEEST is director and RIA OOSTERVELD-hut is export manager at Lambert Instruments (Leutingewolde, The Netherlands); e-mail: [email protected]; www.lambert-instruments.com.


