CELL BIOLOGY/CORRELATIVE MICROSCOPY: A powerful pairing for cell studies: Correlative light and electron microscopy
ByAlex de Marco, Liesbeth Hekking, Anne Greet Bittermann, Maja Magrit Guenther, Roger Wepf, Matthias Langhorst, and Roman Zantl
A workflow protocol illustrates that successful cell biology experiments can be performed using correlative light and electron microscopy (CLEM), which combines data from live cell imaging with that from the highest resolution microscopy methods available today. The result is a rich set of data life scientists can use to achieve better understanding.
Light microscopy provides many benefits to life sciences, but even super-resolution approaches don't reveal the detail that electron microscopy enables. However, because electron microscopy imposes more limitations in terms of sample preparation (which also affects the specimen) and does not allow imaging of living tissue, it is not typically a life scientist's go-to tool.
Combining information from light and electron microscopy, however, adds significant value to biological imaging. The contextual information at the ultrastructure level provided by electron microscopy perfectly complements the specificity, sensitivity, and—best of all, live cell imaging capabilities—of fluorescence microscopy. Wouldn't it be nice, then, to leverage the advantages of both light and electron microscopy for tissue investigations?
Achieving optimal contrast in both modalities, quick relocation to the area of interest and precise correlation between the two is difficult because of differing sample preparation steps. However, pioneers in this field have made significant progress in correlative light and electron microscopy (CLEM). CLEM provides access to both a large field of view and chemical specificity of selective staining (provided by fluorescence microscopy) and to high-resolution ultrastructural details (revealed by electron microscopy). As demonstrated by a growing number of scientific publications, CLEM is a valuable tool for researchers in numerous life sciences fields.
To generalize, the advantages that light microscopy provides in a CLEM experiment fall into three main categories:
1. Haystack/needle localization: The light microscopy element of CLEM enables screening of a complex and heterogeneous sample to identify rare events that are difficult or impossible to distinguish using electron microscopy;
2. Context provision: Light microscope imagery provides context to better understand ultrastructure data that shows only a limited area in the sample; and
3. Augmentation: Coupling low-resolution dynamic data and high-resolution ultrastructural data boosts the information content of imaging data.
Instead of being one specific technique, CLEM is actually a family of techniques. CLEM offers a large choice of imaging techniques in both light and electron microscopy, and there are different requirements in sample preparation protocols to accommodate a variety of specimens and various imaging approaches. It is even possible to perform experiments on fresh samples, followed by resin-embedded or frozen-hydrated samples—though this increases complexity.
FEI Company (Hillsboro, OR) recently introduced new solutions to overcome the difficulty of correlating light and electron microscopy data, including CorrSight, a dedicated light microscopy system offering CLEM-specific functionality and automation of important workflow steps; and MAPS, a software tool bridging the modalities to increase ease of use.
A versatile cell-bio workflow
An international group of scientists in industry and academe—from Dutch and American microscopy developer FEI, the Swiss university ETH Zurich, and German cell imaging specialist IBIDI—collaborated to develop a CLEM workflow protocol. Described here, the workflow was designed to fulfill the needs of multiple cases in cell biology experiments from imaging of live, cultured cells to the 3D analysis of cellular ultrastructure. It focuses not on sample preparation, but on a data collection scheme and the use of dedicated tools to allow the user to follow a feature of interest—independent of the procedure and any problems encountered.
For long and complex experiments, it is crucial to ensure that all time points in the workflow are well documented. Our solution for this was FEI MAPS2.0 software, which runs on both the light and the electron microscopes to ensure that a map composed of all collected images is registered to the stage of the used tool. Its ability to store large tilesets and automatically register existing data with the latest sample enabled tracking of individual cellular structures along the entire sample workflow. The main goal of this experiment was to prove the traceability of individual regions of interest, regardless of the imaging modality and embedding medium.
The group demonstrated its protocol with proof-of-principle experiments, as demonstrated below.
Experiment 1: With marker grid
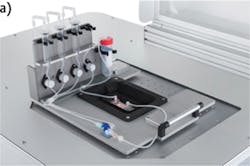
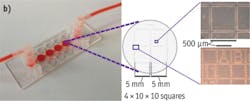
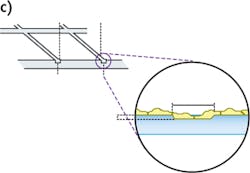
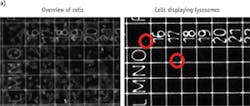
The first experiment started with cell culture using the FEI CorrSight Module Live (see Fig. 2a). This sample holder allows incubation at 37°C in a gas-controlled atmosphere with constant supply and exchange of a variety of media to cells that are cultured in microfluidic chambers. A marker grid, etched into the bottom surface of the fluidic chambers, is visible in both the light and electron microscopes and facilitates navigation during the experiment (see Figs. 2b, 2c, and 3).
Imaging of living cells was conducted in optimal conditions, thanks to the optical quality of the fluidic slides. Once the cells were allowed to settle/attach, they were incubated with a lysosomal marker and fixed. As shown in Fig. 3a, the number of lysosomes present in the culture was extremely limited; this highlights how critical it is to use the large field of view and the specific markers available in light microscopy (LM) before homing in on the feature of interest with electron microscopy (EM).
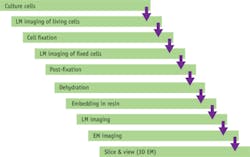
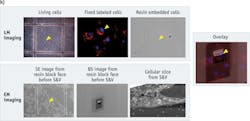
After the light microscopy inspection was concluded, the sample was prepared for EM imaging. Staining with OsO4, dehydration, and treatment with Epon embedding resin are all processes that can induce changes in the sample morphology. As shown in Fig. 3b, we took snapshots at each stage of the sample processing on both LM and EM, making sure that the preexisting high-resolution LM map would fit into the latest map of the sample. This procedure can be done easily in FEI MAPS2.0 using a multipoint alignment that ensures adaptations of any image to be a navigation map on the microscope.
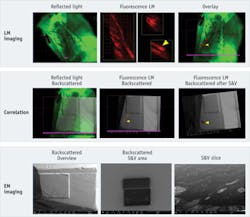
Once identified in the focused ion beam (FIB) or scanning electron microscope (SEM), the cellular ultrastructure of the region of interest that was found in the light microscope can be inspected in 3D by performing a slice-and-view experiment. This type of experiment is highly time-consuming, and CLEM provides significant value for navigating toward features of interest that otherwise could be located only by chance. As shown in Fig. 3b, we identified the position of a lysosome and performed the slice-and-view experiment only on the cell displaying it.
Experiment 2: Sans grid
The second experiment was planned to verify the possibility of correlating in absence of marker-grids. Here, we embedded in Epon fluorescent mouse skin tissue. The block was pre-trimmed to have the tissue right at the tip of the block. We scratched the block face with a razor blade to create marks that we used to simplify correlation.
We imaged first using reflected light illumination to allow taking the map of the surface on the block face in the light microscope. Subsequently, we created a map in of the surface in epifluorescence to identify the areas of interest (see Frontis). In this experiment, we decided to target a follicle, which was clearly identifiable through the fluorescence signal.
Thanks to the data management capabilities of FEI MAPS2.0 software, we had all high-resolution images already "microscope-wise" pre-aligned to the low magnification overviews. Therefore, navigation in the SEM and targeting of a defined cell was possible simply after a simple, three-point alignment between the low-magnification LM overview and the EM overview.
As in the first experiment, we then performed a slice-and-view procedure: We defined our area of interest and started an automatic procedure using the FEI AutoSlice&View function.
Samples used in this experiment were prepared and provided at Eidgenössische Technische Hochschule (ETH) Zurich, while data collection was performed in the ScopeM facility of ETH.
Looking ahead
As demonstrated, a complex experiment involving multiple imaging devices and multiple steps in sample preparation can be run smoothly, and factors that have limited sample navigation can be overcome. From our experience, the key to effortless navigation requires the ability to precisely track any difference in information content, sample morphology, and imaging devices at all steps in the experiment. The two experiments demonstrated the absolute independence from the presence of fiducial markers in the sample. In fact, any feature can serve as fiducial, as long as it is visible in all tools used during the workflow.
Thus far, we have demonstrated the ability to locate a structure through 2D LM and perform 3D EM image acquisition. We see that the most obvious step forward for CLEM will be to localize an event of interest from a 3D dataset from the LM and drive a 3D EM acquisition.
Methods
For these experiments, retinal pigment epithelium (RPE) cells were cultured in the correlative fluidic slide (see Fig. 2) produced by IBIDI. In each well, we placed 80 μl DMEM solution with cells; the cells were allowed to attach for 2 h at 37°C. Once the cells had adhered to the slide surface, the wells were sealed with a gas-permeable membrane to allow perfusion with fresh medium as well as gas exchange from the incubation system. Sample environment used for cell culture as well as gridded slides were produced by IBIDI.
To mark the lysosomes, cells were incubated for 90 min with Lysotracker Red at 37°C. Cell fixation was conducted by perfusing the cell culture for 60 min with a solution of paraformaldehyde at 4% in phosphate buffer. Afterwards, fixation cells were incubated for 15 min in DAPI fluorescent stain.
Cells were subsequently fixed with half-strength Karnovsky fixative and prepared for EM imaging through incubation for 1.5 h at 4°C in 1%OsO4 +1.5% KFe(CN)6, then 30 min in tannic acid at room temperature, and 30 more minutes in 1%OsO4 at 4°C. Dehydration was done in an alcohol series ending with 30 min in 100% ethanol before embedding in Epon. Dried and stained tissue was embedded in Epon following the protocol of the kit provided by Sigma Aldrich.
Light microscopy imaging was done on a FEI CorrSight system equipped with widefield and spinning disk confocal. SEM imaging and slice-and-view were conducted on an FEI Helios DualBeam FIB/SEM system (the slice-and-view dataset was collected using FEI AutoSlice&View). Data acquisition, as well as the image correlation of LM and SEM images, was done with FEI MAPS2.0.
ALEX DE MARCO, Ph.D., is product marketing manager, LIESBETH HEKKING, Ph.D., is senior engineer – applications process, and MATTHIAS LANGHORST, Ph.D., is segment director – cell biology solutions with FEI Company (Eindhoven, The Netherlands; www.fei.com). ANNE GREET BITTERMANN, Ph.D., and MAJA MAGRIT GUENTHER are staff scientists with the Scientific Center for Optical and Electron Microscopy (ScopeM) microscopy facility at Eidgenössische Technische Hochschule (ETH) Zurich (Switzerland; www.scopem.ethz.ch), while ROGER WEPF, Ph.D., is director of Electron Microscopy at ETH Zurich (EMEZ; www.emez.ethz.ch) and ROMAN ZANTL, Ph.D., is president of IBIDI GmbH (Martinsried, Germany; http://ibidi.com). Contact Dr. Langhorst at [email protected].
