OCT angiography is shown to detect early-stage glaucoma and its progression
A team of researchers at Mount Sinai Hospital (New York, NY), along with collaborators at Rutgers New Jersey Medical School (Newark, NJ), is using optical coherence tomography angiography (OCTA) to look at the earliest stages of glaucoma and identify characteristic patterns of different forms of glaucoma based on their vascular patterns. The research could lead doctors to diagnose glaucoma cases earlier than ever before and potentially slow down the progression of vision loss.
Related: OCT angiography: A new approach with 'gold standard' capabilities and more
OCT angiography works by analyzing not only the intensity of the reflected signal, but also the time changes in the reflection caused by the motion of red blood cells in blood vessels. While traditional angiography uses dye injections, OCTA is able to analyze and image the eye noninvasively. Using this technology, the research team from the New York Eye and Ear Infirmary of Mount Sinai (NYEE) and the Icahn School of Medicine at Mount Sinai has discovered that all glaucoma patients have fewer blood vessels, or less blood flow to the eyes compared to patients without glaucoma.
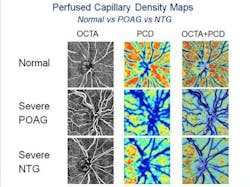
The research team analyzed 92 patients above the age of 50 between April and August 2015. They divided those patients into three groups based on their condition: primary open-angle glaucoma (high pressure), normal-tension glaucoma (low pressure), and no glaucoma. They used OCTA to look at the blood vessels in each patient, and found those with glaucoma had different patterns of defects in the blood flow in the most superficial layer of the retina depending on the type of glaucoma.
Because the research team was able to identify certain characteristic patterns of blood flow that correspond to different types of glaucoma, it may someday allow them to identify certain forms of glaucoma in their early stages, explains lead investigator Richard Rosen, MD, director of retina services at NYEE and research director of ophthalmology at the Icahn School of Medicine. The findings, Rosen says, could lead to new therapeutic strategies to avoid progressive damage in glaucoma patients, and provide a new metric for monitoring early damage that eventually leads to vision loss.
The research team developed new software to analyze the OCTA images, which works by mapping the perfused optic nerve capillaries in each eye to reveal the patterns of the blood vessels feeding the optic nerve fiber layer. They looked at patients with open-angle glaucoma and evaluated how their blood flow distribution differed from patients with normal-tension glaucoma. They then compared the patterns of the blood supply to the patterns of the optic nerve fiber layer loss because of glaucoma. In high-pressure glaucoma, the pattern of blood flow loss closely matched the optic nerve fiber loss. In normal-tension glaucoma cases, the pattern of blood flow loss, while not significantly different from open-angle glaucoma, tended to be more diffuse.
"Normal-tension glaucoma is often picked up late because it’s not recognized if patients don’t have high pressure, causing them to lose nerve fiber and blood supply before diagnosis," says James C. Tsai, MD, MBA, chair of the Department of Ophthalmology at Mount Sinai Health System and president of NYEE. "This study points to vascular factors contributing to normal-tension glaucoma and we can use this to help identify ways to detect the disease earlier, and possibly prevent vision loss."
Further studies will help to refine identification of these characteristic patterns of blood flow that indicate normal-tension glaucoma. Future advancements in technology may also lead to OCTA becoming a standardized imaging modality for the diagnosis and management of glaucoma.
Full details of the work appear in the journal Investigative Ophthalmology & Visual Science; for more information, please visit http://dx.doi.org/10.1167/iovs.15-18945.


