Combining components for Raman-based optical biopsy
Raman spectroscopy promises to revolutionize cancer diagnosis and detection. An understanding of system components and their key parameters can enhance its for applications such as in vivo screening.
By Ed Gooding
Optical spectroscopy provides a rapid, quantitative, noninvasive alternative to traditional cancer screening and detection techniques such as biopsies with histological analysis. Researchers working under Anita Mahadevan-Jansen at Vanderbilt University, Michael Feld at Massachusetts Institute of Technology (see www.bioopticsworld.com/articles/340114), Robert Alfano at City University of New York (see www.bioopticsworld.com/articles/345204) and Arjun Yodh at the University of Pennsylvania (see www.bioopticsworld.com/articles/322985) have demonstrated useful biomedical applications using a variety of spectroscopic approaches.
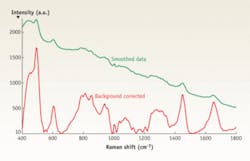
FIGURE 1. Excited by a 785 nm laser, human tissue generates a Raman signal that can be background corrected (red line). (Courtesy of Anita Mahadevan-Jansen, Matthew Keller and Elizabeth Vargis; Department of Biomedical Engineering, Vanderbilt University.)
In particular, Raman spectroscopy has been recently applied to in vivo cancer screening and demonstrated outstanding sensitivity and specificity (see “SORS shows cancer margins,” p. 6). But getting the best results for such applications requires care and attention to the combination of components in a Raman system. So let’s take a look at the inner workings of a Raman-based system for cancer screening. Although there are other design approaches, we will use a lens-based instrument to demonstrate functionality.
Components for sensitivity
An in vivo Raman setup includes, at minimum, a laser line source to excite Raman scattering in tissue, a fiber-optic probe to deliver excitation light and collect scattered photons, a Rayleigh rejection filter, a spectrograph to disperse the scattered light, a detector, and sophisticated analytical tools such as nonlinear principal component analysis to interpret the spectral data.
Raman scattering is a weak effect, and a clinical screening application requires short acquisition times, so the primary requirement of the instrumentation is sensitivity (see Fig. 1). Most investigative work has concentrated on the region from 800 to 1800 cm-1, although some researchers have examined the carbon-hydrogen stretching region around 2900 cm-1. Low frequencies remain a little-explored area for biomedical applications.
Lasers: not too short, not too long
To select a laser source for in vivo Raman spectroscopy one uses the Goldilocks principle: not too short, not too long, but just right. The best choice is NIR excitation at powers of 50 mW to several hundred miliwatts from a narrowband 785 or 830 nm continuous-wave (CW) diode laser. Diode lasers are ideally suited to Raman spectroscopy, although they require active temperature control, which improves wavelength stabilization.
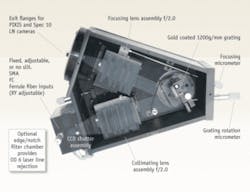
FIGURE 2. Princeton’s Acton Series LS-785 spectrograph combines compound lenses with a planar reflective diffraction grating.
Short-wavelength lasers such as argon ion (Ar+) units operating at 488 nm generate stronger signals because the intensity of nonresonant Raman scattering is proportional to the fourth power of the frequency of the excitation light. For biomedical samples, the fluorescence background can be orders of magnitude stronger than the weak Raman signal. Visible wavelength excitation also degrades biological samples and limits penetration depth, because of absorption by strong chromophores such as hemoglobin. NIR wavelengths have insufficient energy to excite electronic transitions of most biological molecules, and so provide much lower background levels and greater penetration depth while permitting higher average powers to be used without causing tissue damage.
While 1064 nm has traditionally been a popular laser wavelength, particularly for FT Raman instruments, CCD detectors are insensitive to light of wavelength longer than 1050 nm. Collecting a Stokes Raman spectrum with 1064 nm excitation thus requires using a much less sensitive detector such as an InGaAs optical multichannel analyzer (OMA). Such spectra also suffer from interference thanks to a water overtone near 1.4 µm, which reduces the penetration depth and necessitates a somewhat complicated self-absorption correction.
High-throughput and good image quality are key
As was demonstrated by a recent in-depth review of NIR Raman systems, the essential requirements of an in vivo Raman spectrograph are high throughput and good imaging quality.1
The elements of a spectrograph include light collection and focusing optics, either mirrors or lenses; a dispersive element, typically a grating but occasionally a prism; an entrance slit; and an enclosure that minimizes stray and scattered light. Spectrograph throughput is primarily determined by light collection efficiency. A “fast” spectrograph designed to collect light over a large solid angle is inherently more efficient than a “slow” instrument that sees a smaller solid angle. In fact, for optics of equal size, collection efficiency increases as the inverse square of the f/#. Typical compact Czerny-Turner mirror-based spectrographs operate at f/4. Using faster optics while maintaining the optical elements at a reasonable size requires use of a short focal length.
One example, the Acton Series LS-785 (Princeton Instruments, Trenton, NJ) was designed to address the throughput and imaging requirements by combining compound lenses with a planar reflective diffraction grating (see Fig. 2). (Alternate designs use volume holographic transmission gratings or convex reflection gratings.) With a focal length of 85 mm and an aperture of f/2, it offers 4x the light-collecting power of an f/4 instrument. This design is well matched to the numerical aperture of the optical fibers that are used to collect Raman scattered light. Using the relation f/# = 1/(2*N.A.), one can see that a typical fiber with an N.A. of 0.22 has an f/# of 2.27, which is well matched to the optics of the LS-785.
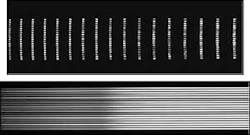
While a lens spectrograph offers a large aperture, the design has the disadvantage that refractive elements, unlike metal mirrors, are inherently chromatic. Even with careful lens design, chromatic correction can be accomplished only over a limited spectral range. The LS-785 uses a matched pair of multielement lens assemblies containing glasses of contrasting refractive index that minimize chromatic aberration over from 750 to 1050 nm. The lens design minimizes spherical and other aberrations and astigmatism, and is optimized for point-to-point imaging of the entrance slit onto a flat exit focal plane of 8 × 27 mm to provide the best possible imaging with a CCD detector (see Fig. 3).
Spectrograph dispersion is determined by the grating groove density, inclusion angle and focal length according to the familiar grating equation. The LS-785 has a planar ruled diffraction grating with a groove density of 1200 lines per mm, resulting in a dispersion of 6.12 nm/mm at a center wavelength of 900 nm. Using a 25 µm entrance slit (or, equivalently, with a 25 µm fiber input), this gives a resolution of 5 ± 1 cm-1 when focused onto a CCD detector with 20 µm pixels. This resolution is adequate to resolve Raman spectral lines of biomedical interest, which are typically well over 10 cm-1 in width.
Reflection losses from the optical surfaces can significantly reduce the transmission of a lens spectrograph, so it is important to apply efficient antireflection (AR) coatings to all optics in the beam path. AR coatings custom designed and manufactured for the LS-785 increase the transmission of each lens to 99.4% or higher, resulting in total transmission of greater than 94% for the lens assemblies. To further maximize NIR throughput, gratings are gold coated resulting in total measured system throughput of greater than 68% at 785 nm.
The best detectors
Until the 1980s, the only acceptable detector choice was a cooled photomultiplier tube (PMT) operating with a scanning monochromator. Modern detection systems use an array detector to collect all channels of dispersed light simultaneously. The charge-coupled device (CCD) has no competitor in its range of operation, from below 200 nm to around 1050 nm, where the long-wavelength limit is determined by the bandgap of silicon.
Cooled CCD detectors offer read noise and dark charge of just a few photoelectrons per acquisition. TE cooled CCDs combine convenience and deep cooling capability down to -70°C or below. Liquid nitrogen-cooled CCDs offer cooling to -120°C, reducing the dark charge accumulation to nearly zero. This is useful for very long acquisitions, but is unnecessary in a clinical screening context.
CCD architecture affects the detector quantum efficiency. Front-illuminated (FI) CCDs are inexpensive, but the pixel area is partly obscured by the electrodes. Their peak quantum efficiency (QE) is limited to approximately 50% for conventional FI designs, or about 60% in the case of open electrode detectors. In back-illuminated CCDs, the electrodes are located on the opposite side of the active area, which is only approximately 20 µm thick, and peak QEs of over 90% are routinely obtained with the help of antireflection coatings.
A disadvantage of back-illuminated CCDs for NIR applications is that longer wavelength photons are not completely absorbed in the silicon active layer, but partially reflected within the material, leading to objectionable interference fringes. This effect, known as etaloning, can be nearly eliminated–at the expense of slightly higher dark current–by using a thicker active layer, which is termed deep depletion. Research by CCD manufacturers such as e2v (Chelmsford, England) continues actively on further improvements in this area.
Electron-multiplying devices (EMCCDs), which offer on-chip gain, are often thought to be more sensitive than conventional CCDs, but for most biomedical Raman applications, spectra are shot-noise limited and the EMCCD offers no signal-to-noise ratio advantage. When video frame rates are desired in an imaging application, however, an EMCCD is the detector of choice.
Separating the Raman from the Rayleigh
In nonresonant light-scattering experiments, typically only one photon in approximately 107 is Raman scattered. The rest are Rayleigh scattered at the excitation wavelength. Raman spectra dispersed using single-stage spectrographs are overwhelmed by the Rayleigh background.
Filters, therefore, are used at the entrance stage of the spectrograph to reject the laser wavelength. Designing an interference filter that combines laser line rejection of 6 OD (optical density units) or more with high transmission in the Raman-shifted region is nontrivial. Holographic notch filters from Kaiser Optical Systems (Ann Arbor, MI) offer excellent performance. Recently, ion-beam-sputtered dielectric long-pass edge filters from Semrock (Rochester, NY) have gained popularity; they offer sharper spectral cutoffs at significantly reduced cost.
FIGURE 3. The spectral image of a 19 x 200 µm fiber bundle obtained with the LS-785 shows minimal aberration across the entire 27 x 4 mm focal plane. Narrowband illumination (top) and white-light illumination (bottom) are shown.
Interference-filter performance is highly sensitive to the angle of incidence, so care must be taken to locate it within an optical setup at a position where the incident light beam is collimated. It is also important to allow for rotation by slight angles relative to the optical axis in order to best match the filter to the laser wavelength.
Probing the future
Fiber-optic probes represent by far the least mature area of in vivo Raman spectroscopy.2
Raman scatter generated by laser light propagating in the fiber-optic probe contributes an unwanted background to the sample spectrum. Successful probe designs incorporate a laser-line filter at the delivery end and a long-pass edge filter at the collection end of the probe. The intensity of scattered light is generally low enough that Raman scatter is not further generated in the collection leg of the probe. This is fortunate, as there is no way a priori to distinguish analyte scatter from fiber scatter. Devices such as the RamanProbe from InPhotonics (Norwood, MA) offer outstanding inline laser line filtration, although the probe diameter is too large to make it ideal for in vivo applications.
Wider acceptance of these techniques depends on clinical trials and education of the medical community. Raman spectroscopy is a rapidly growing field that will provide fast and effective new cancer screening detection tools over the next few years.
REFERENCES
- C. Lieber et al, Appl. Spec. 2008, 62:575
- U. Utzinger and R. Richards-Kortum, J. Biomed. Opt. 2003, 8:121
ED GOODING Ph.D. is Applications Specialist for Princeton Instruments’ Spectroscopy Group, Trenton, NJ. Contact him at [email protected].


