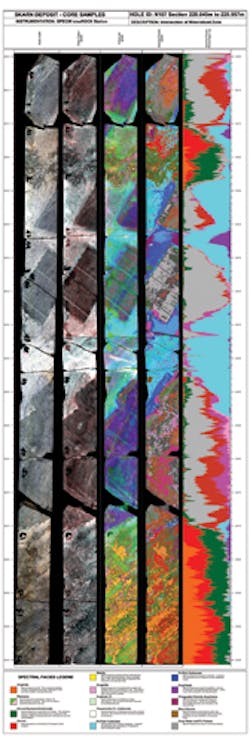
Hyperspectral scans analyze a century's worth of earth samples

Prehistory is written in rock, and hydrogeologist Cynthia Gefvert, P.G., studies slices of cores drilled from the earth to understand its impact on life today. Each slice is analyzed to determine such properties as porosity and permeability, which helps her agency—the South Florida Water Management District—understand water's ability to move underground. "But," says Gefvert, Section Leader in Water Supply Planning, because the slices represent minor percentages of the overall picture, "you may be missing some important information several feet above or below." This is why she's so intrigued by the Geological Survey of Sweden (SGU)'s new €1.7 million ($2.3 million) initiative to scan entire cores.
In one of the world's largest optical and mineralogical core scanning projects, SGU has contracted with SPECIM (Oulu, Finland)—and SPECIM's South-African partner GeoSpectral Imaging (GSI)—to scan and analyze 200 km of hyperspectral imaging data of archived drill core representing more than 100 years of exploration. "The use of hyperspectral imaging to analyze drill cores is relatively new," explained Ana Aranda González, a SPECIM regional sales manager. While there are some single-point near-infrared (NIR) measurement solutions available, they are limited to analyzing slices.
With this nondestructive and noncontact technique, each of SGU's drill core boxes are placed in a sample tray, and cameras located overhead scan the full core simultaneously. An RGB camera provides a high-resolution picture (optical imaging data), and spectral images in various ranges—visible-NIR (VNIR; 380–1000 nm), short-wavelength IR (SWIR; 1000–2500 nm), and long-wavelength IR (LWIR; 8–12 μm)—determine mineralogical value. SPECIM's SisuROCK scanner and GSI's processing capability provide the speed and performance to make the project economically viable, said Rainer Bärs, Project Manager, Hyperspectral Sensors and Software at SPECIM. The pushbroom, line scan technology generates spectral data for every spatial pixel of the drill core, and the system can scan 150 drill core boxes per day.
Matching for minerals
González explains that the characteristics of different minerals become apparent by scanning in different wavelength ranges. For example, iron oxides can be detected in the VNIR spectral range (400–100 nm), while micas, clays, and many other minerals require the SWIR range. LWIR provides very valuable information when combined with SWIR; a cooled LWIR spectral camera is needed to distinguish, for instance, among different types of feldspars. In fact, after scanning, the data generated is compared with spectra of known minerals for identification. "Data interpretation plays an important role, since presence of water molecules or core shape or grains form may have an effect on the data," González says.
The project will result in a uniform national drill core data base for further macroanalysis. Kaj Lax, Head of Mineral Resources department at SGU, explains that the additional information extracted from SGU's "voluminous asset of drill cores" will be freely available on the Internet. The project will transform Sweden's mineralogical data into digitized, actionable insight and "will be of great value for exploration, research, and mapping," Lax said.
Gefvert says that the project is "a true legacy for the scientists who collected the cores," and that "all too often, drill cores and other data sits somewhere collecting dust." In this case, though, "the data and analysis will provide useful geologic data for many scientists for years to come."
About the Author

Barbara Gefvert
Editor-in-Chief, BioOptics World (2008-2020)
Barbara G. Gefvert has been a science and technology editor and writer since 1987, and served as editor in chief on multiple publications, including Sensors magazine for nearly a decade.