SPECTROSCOPY/NONINVASIVE DIAGNOSIS/BREATH ANALYSIS: Noninvasive medical breath analysis with sensitive IR spectroscopy
Stefan T. Persijn and Adriaan M.H. van der Veen
To perform the first comprehensive breath studies, two-time Nobel Prize winner Linus Pauling collected the gas from 10–15 exhalations in a cold tube. After heating the tube, he used gas chromatography to analyze the released gases—and discovered the presence of a few hundred substances.
Pauling's work, done in 1971, required the accumulation step because most molecules in breath are present at or below the parts-per-billion (ppb) level only. Otherwise, detecting such low biomarker concentrations would require a detector more sensitive than has been available. But rapid advances in measurement techniques are now enabling breath analysis without concentration. These advances could transform health care by enabling noninvasive diagnosis as well as monitoring of therapeutic success and assessment of medication adherence.
"Breath analysis as a tool for early disease detection" is the name of a project by iMERA (implementing Metrology in the European Research Area), an initiative of the European Metrology Research Programme (EMRP). The project is focused on reliable identification of several species present in exhaled breath, and involves both the development of suitable infrared spectrometers and the performance of pilot breath experiments. The necessary high sensitivity was achieved by combining the sensitive cavity ring-down spectroscopy technique with a versatile mid-infrared (MIR) light source.
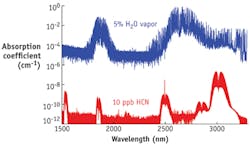
In the MIR wavelength range, around λ = 3 μm, many potential biomarkers possess strong absorption bands. Line strengths of most molecules (that is, the amount of energy absorbed in the atmosphere, which depends on molecular concentration) are about 100 times as strong in the MIR as in the near-IR (NIR). Selection of the optimum detection wavelength is, however, not solely based on line strength, but also on the availability of a suitable light source and on the level of spectral interference by such constituents as water vapor and carbon dioxide, both of which are present at a level of about 5% in human breath (see Fig. 1).
Versatile MIR source: OPO
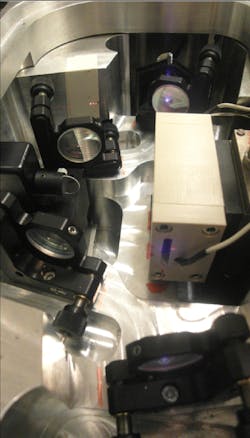
To get access to the MIR, engineers at VSL, the National Metrology Institute of The Netherlands, constructed a singly resonant, continuous-wave optical parametric oscillator (OPO; see Fig. 2).1,2 In the OPO, a lightwave called "pump," with frequency ωpump, is converted into two output waves of lower frequency, known as ωsignal and ωidler. The conversion by means of second-order nonlinear optical interaction occurs in a periodically polled nonlinear crystal. The input wave frequency equals the sum of the output waves' frequencies; i.e., ωpump = ωsignal + ωidler. The crystal is placed inside a bowtie cavity, which has mirrors that are highly reflective for the signal (i.e., the signal is resonant) and transparent for the pump and idler wavelengths.An 8 W, single-frequency, distributed feedback (DFB) fiber laser with a center wavelength of 1064 nm serves a pump source for the OPO. The 'heart' of the OPO is formed by a periodically poled lithium niobate (PPLN) crystal with a so-called fan-out structure to enable wide tuning. In this crystal, the poling period gradually changes along the crystal height. By translating the crystal using a computer-controlled micrometer, we were able to achieve continuous tuning over more than 100 nm—which is sufficient to measure the broad absorption patterns of many of the large molecules. The total tuning range of the idler wavelength is 2.7–3.5 μm and the idler power amounts up to 1 W.
Cavity ring-down spectrometer
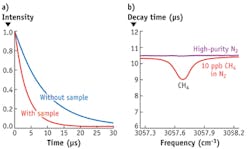
Detecting the low concentrations of biomarkers present in breath necessitates the use of a very sensitive method. One of the most sensitive spectroscopic techniques is known as cavity ring-down spectroscopy (CRDS). In CRDS, light is trapped for several microseconds in between two highly reflective mirrors (in the MIR, R~99.98%). The intensity of the light leaking out through the end mirror is recorded using a fast photodetector. In case an absorbing gas is present inside the measurement cell, the decay time will be faster (see Fig. 3a). The decay time is a measure for the concentration of the absorbing molecules. The maximum effective absorption path length the system can reach is 4 km for a cell length of 50 cm.By recording the decay time at different wavelengths, it is possible to identify (each molecule has a unique 'fingerprint' spectrum) and quantify the molecules present in the sample (see Fig. 3b). Typical detection limits of the system are at the sub-parts-per-billion level. Compounds of medical interest that have been measured with this system include acetone, ammonia, ethane, hydrogen cyanide (HCN), and formaldehyde. The latter two are difficult to measure with other techniques at the levels relevant in exhaled breath analysis. The spectrometer was put to the test in a series of experiments at VSL in cooperation with the Medical Centre and the Life Science Trace Gas Facility of the Radboud University Nijmegen (Nijmegen, The Netherlands).3
Medical application
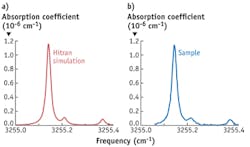
Cystic fibrosis (CF)—a disease affecting the respiratory system—is the most common lethal genetic disease in the Caucasian population, affecting more than 70,000 individuals worldwide. Most adult persons suffering from CF are infected by the bacteria Pseudomonas aeruginosa. Early treatment of the infection leads to a pronounced survival benefit. Sputum culture is currently the gold standard for detection of Pseudomonas aeruginosa; however, due to age or condition of CF patients, it is often not possible to obtain adequate sputum samples. Pseudomonas aeruginosa is one of the few bacterial species known to produce HCN; therefore, detection of HCN in exhaled breath might be a useful noninvasive tool for both diagnosis and monitoring of infection in CF patients.In a series of on-line experiments, HCN release by this bacteria was measured. HCN production is supposedly increased under micro-aerobic (low oxygen) conditions, which characterizes the habitat of Pseudomonas aeruginosa in vivo. To test this, we exposed the bacteria to a continuous flow of a nitrogen-oxygen mixture and measured the HCN release. To reduce the strong spectral interference by water vapor, we lowered the pressure in the measurement cell to 100 mbar, and in addition selectively reduced the H2O level using a semi-permeable membrane. Figure 4 shows an example of the result of on-line measurement of the measured gas release. The measured spectrum matches well with a simulation of the HCN spectrum based on data from HITRAN, a standard for calculating or simulating atmospheric molecular transmission and radiance. Thus, we were able to determine that the released compound is indeed HCN.
HCN production was measured well above the detection limit from Pseudomonas aeruginosa cultures. In general, HCN levels were found to be higher when oxygen levels were low (1%) rather than when oxygen levels were high (between 10 and 21%). These results support the idea that HCN production is increased under microaerobic conditions, which are typical for their habitat.
In another application demonstration, we measured breath samples of both smokers and non-smokers. We found elevated HCN levels (tens of parts per billion) in the breath of smokers, while much lower HCN levels (typically a few parts per billion) were present in the breath of non-smokers.
A next step is to measure the breath of persons suffering from CF, as current methods to establish infection by Pseudomonas aeruginosa are very invasive. The results shown here indicate that the developed spectrometer has potential to determine infection noninvasively by measuring HCN release in breath.
ACKNOWLEDGEMENT
This work was financially supported by the Dutch Ministry of Economic Affairs and the European Community's 7th Framework Programme, ERA-NET+, under the iMERA+ project, grant agreement number 217257.
REFERENCES
1. S.T. Persijn, F. Harren, and A. van der Veen, Appl. Phys. B, 100, 383–390 (2010).
2. D. Arslanov et al., Laser & Photon. Rev., doi:10.1002/lpor.201100036 (2012).
3. E.P.M. Verschuren et al., Annual Congress from the European Respiratory Society, Amsterdam, The Netherlands (September 24–28, 2011).
Stefan Persijn is a researcher and Adriaan van der Veen is project manager, R&D, at VSL, the Dutch Metrology Institute, Delft, The Netherlands; www.vsl.nl. Contact Persijn at [email protected].


