BIOSPECTROSCOPY/CARDIOLOGY: High-wavenumber Raman reveals composition and location of intracoronary plaques
James F. Brennan III
Among the diseases of the industrialized world, atherosclerosis is overwhelmingly the prime disorder leading to death and serious morbidity. Although it can affect any artery, the aorta and the coronary and cerebral systems are the prime targets—with myocardial infarcts and strokes being two main consequences of the disease.
Currently, there is no method for accurately pinpointing plaques likely to cause heart attacks and strokes. But researchers are exploring the capability of several intravascular diagnostic technologies to identify atherosclerotic plaques that may cause untoward acute clinical events. New developments to enable rapid analysis of tissue within arterial walls also aim to provide interventional cardiologists with precise chemical composition data in real time.
What's in a plaque
Atherosclerotic plaque composition, rather than size or volume, seems to determine whether a given lesion will rupture and cause an acceleration of clinical symptoms. Specifically, the progression and regression of certain plaques appear to be related to the amount and type of lipids that has accumulated within an artery. Intimal xanthomas, or "fatty streaks," exhibit fat-laden macrophages, while pathological intimal thickening generally presents smooth muscle cells surrounded by extracellular lipid droplets and lipid pools.1
Fibroatheroma, an advanced plaque, has a layer of fibrous tissue confining an area of necrosis-and the necrotic core shows numerous cholesterol clefts, cellular debris and an absence of extracellular matrix. The thickness of this fibrous layer over the core is used to distinguish between a standard fibroatheroma and the thin cap fibroatheroma commonly referred to as a "vulnerable plaque." The relative amounts of non-esterified (free) cholesterol to esterified cholesterol increase in ruptured plaques as compared to less advanced plaques.1
High wavenumber Raman spectroscopy
Since the early 1990s, Raman spectroscopy has been used to quickly and non-destructively assay chemicals in human artery tissues and to characterize plaques in-vivo.2,3 A Raman spectrum of cholesterol can be divided readily into the 'fingerprint' and 'high wavenumber' regions (see Fig. 1). Most Raman studies are conducted in the fingerprint region due to its wide range and rich structure, but clinical applications using optical fiber-based catheters have been hindered by background signals that the silica fibers themselves generate. Previous in-vivo fingerprint catheters overcame this problem by using dedicated delivery and collection fibers equipped with filters and optics at the ends of the fiber bundles—but the result was a catheter too bulky for routine cardiovascular use.
Over the past several years, researchers realized that the background signal generated from an optical fiber is reduced significantly in the high wavenumber (HW) Raman region (~2400 cm-1 to ~3800 cm-1), and, with proper selection of optical fibers, one can collect quality HW Raman spectra remotely via a single optical fiber with no additional filters or optics.4
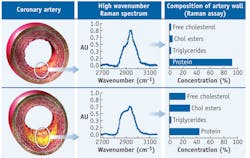
In HW Raman measurement of coronary arteries, a non-atherosclerotic specimen shows a spectrum similar to that of a protein, while a fibroatheroma shows a marked increase in spectral intensity at ~2850 cm-1, indicative of increased lipid concentrations (see Fig. 2).Artery chemistry calculated with Raman spectra
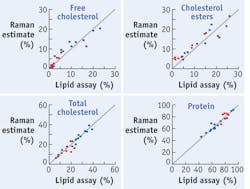
Raman spectra can be processed to provide accurate estimates of chemical compounds within arterial walls. This fact is demonstrated by a model of the HW artery spectra that my research team developed using a data set consisting of spectra and chemical assay values from several unique homogenized tissue samples.5 The spectra in the calibration set were decomposed with principle component analysis, and the dominant factors were retained. We made an initial assessment of the predictive ability of this model by retrospectively examining the calibration data set (see Fig. 3).In addition, we created a second data set to validate the predictive ability of the HW spectra model, and used it to collect and process spectra to calculate chemical concentrations (also see Fig. 3). We combined the comparison data for all the cholesterols, non-esterified cholesterol (FC) and esterified cholesterol (CE), to form a total cholesterol (TC = FC + CE) category, which we also examined for prediction accuracy. The concentration calculations turned out to be off by a few percentage points, but showed that HW Raman spectra can be used to quantify the relative weights of cholesterols and proteins that are present in coronary artery tissue.5
Raman spectroscopy instrumentation
Based on these research results, Prescient Medical has devised an intravascular Raman system—called vPredict—with a disposable catheter to deliver excitation light to, and collect scattered light from, multiple locations within coronary arteries. The system couples laser light into an optical fiber and guides it, using the fiber in the catheter, to a target site within an artery. The distal end of the output fiber facet is angled to direct excitation light onto the vessel wall, and the resulting scattered light is collected by the same fiber and guided back through the catheter to a spectrometer system. This construction is cost-effective and simple to assemble, without the need for expensive optical elements and for sensitive alignments within the catheter. To provide circumferential sampling of an arterial wall, the catheter includes multiple sensors that are evenly distributed circumferentially (see Fig. 4). The collected light gathered by each sensor is guided to a spectrometer, where it is individually measured and processed.Prototype rapid-exchange catheters are ~3.6 F in diameter, compatible with 6 F guide catheters and pullwire-deployable to measure vessels < 4.5 mm in diameter. Other catheter designs with smaller profiles and different deployment mechanisms are in development. Each optical fiber sensor within the catheter illuminates the arterial wall with < 25 mW of ~671 nm wavelength light, collects the scattered light and guides it to a spectrometer, where it is processed and analyzed in the ~825 to ~850 nm wavelength range (~2800 to ~3100 cm-1). Quality spectra can be obtained within as little as a ~200 ms collection time.
The system is deployed during percutaneous heart surgery. The catheter is inserted into the artery and can be withdrawn, either manually or automatically, to collect sequential spectra along the vessel's length. Initial positioning of the catheter relative to the surrounding anatomy can be determined with fluoroscopy utilizing radio-opaque markers on the catheter distal end, and relative angular positioning is ascertained by registration of the proximal catheter fibers with the distal catheter end. If the pullback is at a constant rate (e.g., ~0.5 mm/sec), the location within the artery of the distal end of the catheter sensors is inferred with knowledge of the elapsed time after pullback initiation and supplemented by fluoroscopy images of the markers in the catheter distal end.
Contour maps of chemical concentrations
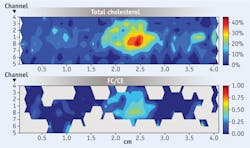
The HW Raman catheter enables full circumferential sampling of an artery during pullback, providing information about the location and concentration of chemicals within an entire artery lumen. A convenient method to display this information is through contour mapping. In examination of a human coronary artery segment, the collected spectra were processed to calculate the relative concentrations of several chemical compounds within the artery, and then 2D contour mappings of the chemical concentrations were constructed from the linear and circumferential measurements obtained during a pullback. When the amount of total cholesterol was >5%, we calculated the ratio of FC to CE concentrations and created contour maps of the result. The plot abscissa indicates the length along the sample, while the ordinate indicates which fiber sensor is recording information along a given row. Color coding is used to accentuate the contour plots of the component concentrations in a given map. In the map of the ratio of free cholesterol to esterified cholesterol (FC/CE), a large increase in the FC content within the focal deposit suggests the presence of a necrotic core containing crystalline cholesterol.
Near future
The HW Raman approach promises to enable patient risk assessment and, for the first time, treatment of the cause of heart attacks before they occur.
Short-term applications for the vPredict system include guiding selection and placement of stents, which can be especially important for acute coronary syndrome (ACS) and acute myocardial infarction (AMI) patients, as well as for those with diabetes. It may be applied to determine whether patients should receive bare-metal or drug-eluting stents (DES)—a decision that can significantly affect healthcare costs when considering the costs associated with long-term anti-platelet medication for DES. Additionally, the system can help determinine the proximity of lesions that could rupture near flow-limiting lesions when placing a balloon-expandable stent.
REFERENCES
1. R. Virmani et al., The Vulnerable Atherosclerotic Plaque (2007)
2. J.F. Brennan III et al., Circulation 96: 99-105 (1997)
3. T.J. Römer et al., Circulation 97: 878-885 (1998)
4. S. Koljenovic´ et al., J Biomedical Optics 10: 031116 (2005)
5. J.H. Nazemi and J.F. Brennan III, J Biomedical Optics 14: 034009-1-6 (2009)
JAMES F. BRENNAN III, Ph.D., is Chief Science Officer with Prescient Medical, Inc., Doylestown, PA; www.prescientmedical.com; e-mail: [email protected].


