Pathogen detection with hyperspectral dark-field microscopy
Contamination of food products from common pathogens, including Salmonella, Campylobacter, E. coli, and others, is a serious health issue worldwide, costing the U.S. $77.7 billion annually.1
Conventional detection methods for evaluating such threats take days to provide results, because they are based on biochemical assays requiring sample preparation. Attempts to develop optical approaches have mostly relied on generation and detection of fluorescence, Raman, or a combination of other specifically excited signals—methods that require powerful, hazardous, and costly excitation sources such as high-powered lasers, along with strong concentrations of the pathogens. So, these approaches have involved days-long sample preparation and enrichment. In addition, instruments based on these mechanisms typically cannot differentiate between serotypes and species.
Now, multi- and hyperspectral imaging technologies have introduced new possibilities in detection and identification of food-borne pathogens from specimen samples extracted during processing (that is, rinse or wash water) and potentially as part of in-line inspection on the product itself or within the food matrix. These techniques promise to fulfill the vision of reducing both cost and severity of outbreaks.
Hyperspectral imaging
Hyperspectral cameras capture the spectrum of each pixel in an image to create ‘hyper-cubes’ of data. By comparing the spectra of pixels, these imagers can immediately discern subtle reflected color differences that are indistinguishable to the human eye or even to color (RGB) cameras.
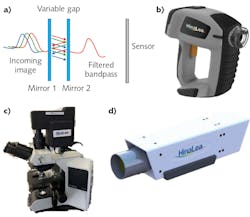
Among the technologies that enable spectral imaging are Fabry-Perot interferometers (FPIs; see Fig. 1a), which allow high-finesse spectral filtering and thus are well suited for pathogen detection. FPIs form the basis of the world’s first battery-operated, handheld staring hyperspectral camera (see Fig. 1b), which captures multi-megapixel images in 550 spectral bands in as little as 2 s, and provides real-time processing by identifying and classifying features of interest2 in both the spectral and spatial domains. Developed by HinaLea Imaging (Emeryville, CA), the technology can easily be configured into form factors and configurations suitable for microscopy (see Fig. 1c), laboratory benchtop investigations (see Fig. 1d), and production line testing. Such an implementation has not been broadly accessible with other similar band sequential techniques (for example, acousto-optic tunable filters and liquid-crystal tunable filters) due to cost, speed, reproducibility issues, environmental, and power restrictions.The use of hyperspectral cameras has already enabled notable success in tissue and cell biology, involving transmission or brightfield illumination and specimens either stained or treated with fluorophores or quantum dots. In microscopy, hyperspectral imaging overcomes limitations of human vision and color cameras to distinguish subtle color differences particularly due to spatially overlapping emissions from stains and fluorescence sources (that is, unmixing), and to explore cell condition and function in addition to structure in research and clinical diagnosis methods such as immunochemistry.3,4
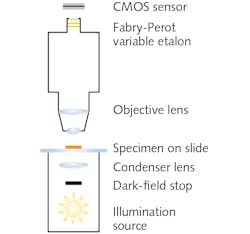
Dark-field microscopy, which images using only light scattered by the sample, involves a field stop in front of the broadband illumination source and condenser (see Fig. 2). The stop creates a hollow light cone comprised of only oblique rays. Although the numerical aperture (typically ~1.2) of the lamp-condenser is unchanged, these oblique rays do not enter unless they strike the specimen. The resulting observed image portrays bright outlines of the specimen due to refraction against a dark background. Most foodborne pathogens are best observed using dark-field oil immersion objectives with magnifications of 10x.Under dark-field illumination, specimens yield unique spectral signatures without the need for staining, addition of reagents or analytes, or genetic modification. Thus, additional processing is avoided.
Pathogen classification
Hyperspectral imaging data-cubes can be processed using a combination of supervised machine learning clustering algorithms that are first trained on sample data-cubes of pathogens. Trained algorithms can be used to recognize, identify, and mathematically group spectral and spatial characteristics (including spectral profiles or signatures, shape, and size) associated with specific pathogenic species and serotypes in unknown samples.
The most basic and common algorithm in microscopy is linear spectral unmixing. This method assumes the spectrum of each pixel is a linear combination (weighted average) of all end-members in the pixel and thus requires a priori knowledge (i.e., reference spectra). Various algorithms such as linear interpolation are used to solve n (number of bands) equations for each pixel, where the n is greater than the number of end-member pixel fractions.
The numerous machine learning methods available to facilitate this work represent large matrices of spectral data as vectors in a n-dimensional space. For example, principle component analysis (PCA) can simplify complexity in high-dimensional data while retaining trends and patterns by transforming data into fewer dimensions to summarize features. PCA geometrically projects data onto lower dimensions (called principal components); it aims to summarize a dataset using a limited number of components by minimizing the total distance between the data and their projections.5
K-Means is an iterative clustering algorithm that classifies data into groups starting with a set of randomly determined cluster centers. Each pixel in the image is then assigned to the nearest cluster center by distance, and each center is then re-computed as the centroid of all pixels assigned to the cluster. This process repeats until a desired threshold is achieved.
Insensitive to brightness differences,6,7 the spectral angle mapper (SAM) compares given spectra to a known spectrum, treating both as vectors and calculating the “spectral angle” between them, and then grouping them with respect to a threshold based on that angle. A composite image can then be generated from the processed grouped data, providing clear indication of pathogenic species and their loading. A subsequent threshold based on statistical likelihood can provide a binary answer or response (for example, false color image presentation, “go/no go” flags, or warnings), resulting in automating detection and enabling fast identification and intuitive visualizations.
Automated detection
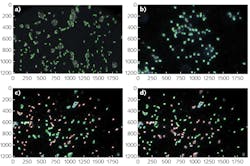
To demonstrate identification of foodborne pathogens using dark-field microscopy and hyperspectral imaging, we captured data from slides containing isolate and mixed specimens of E. coli and Listeria monocytogenes. These samples were incubated for enhancement and transferred to plate media, where colonies were extracted and placed on slides following a U.S. FDA protocol involving immobilization with distilled ionized water and fixed via approximately 10 min. air-dry in a biosafety cabinet with a cover slip applied.
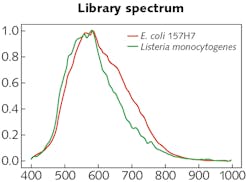
The experimental setup was comprised of the HinaLea Imaging Model 4200M hyperspectral imaging camera coupled to the camera port of an Olympus BX43 microscope equipped with a dark-field illumination substage module and a 100 W quartz tungsten halogen lamp source. The infrared blocking filter was removed to exploit the full spectral range of the 4200M (400–1000 nm).OpenCV library tools were used to develop algorithms for identifying cells based on sample images. Specifically, the SAM was modified, which calculates a spectral angle between library spectra and the mean spectra of each cell. It was determined that a spectral angle <0.107 was an optimum threshold for differentiating between background objects, noise, and other cell types. Cells were marked within that spectral angle as positive using a green outline. Cells beyond that threshold are marked as negative with a red outline. Then, identification of pathogens in a mixed sample of E. coli 157:H7 and Listeria monocytogenes was demonstrated (see image at top of this page). As the specimen samples were known, the classification performance yielded accuracy between 95% and 100%.
Deep learning for classification
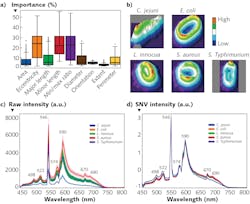
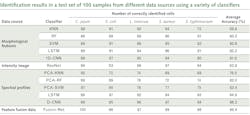
Recently, the U.S. Department of Agriculture (USDA) Agricultural Research Service (ARS) in Athens, GA developed a classification method based on not only spectral profiles, but also morphology (shape) and intensity (distribution of brightness). This approach uses a hybrid deep learning framework, long-short term memory (LSTM) network, deep residual network (ResNet), and one-dimensional convolutional neural networks (1D-CNN).8
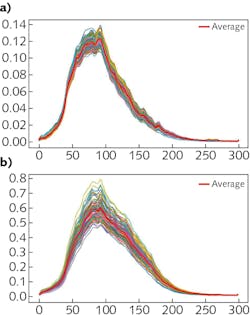
Spectral data are obtained for cellular averages as previously discussed. Intensity images were converted to 16-bit grayscale and a min-max normalization applied. Standard scaler normalization applied to morphology removed mean and scaling variances, while a tree-structured parzen estimator (TPE) optimization method provided automatic tuning of hyperparameters. These were all evaluated simultaneously through a fusion strategy involving concatenation within the layers of the neural networks in the Fusion-Net deep learning network.What’s next
The potential for dark-field hyperspectral microscopy to facilitate pathogen detection in specimens drawn from food processing operations has been demonstrated. The approach requires almost no sample preparation and has high sensitivity and specificity, as it can detect and identify a pathogen at the single-cell level. Unlike biochemical assay techniques, there is no requirement for a critical volume of cell material to react with an analyte. Although enrichment was used to facilitate location of cells within a slide’s field of view (FOV), there is the potential to shorten the time required and possibly eliminate it.
In samples with little or no incubation or other enhancement, specimens are typically presented as sparsely distributed over a large FOV. Here, statistical and machine learning methods for anomaly detection and targeting at the pixel and sub-pixel can rapidly locate and identify individual cells. Such targeting algorithms can also be combined with precision stages and large FOV collection optics to expedite detection.
Within the framework of collaborative research, HinaLea Imaging and the USDA-ARS are evaluating other artificial intelligence (AI) classification algorithms, and have demonstrated even greater performance with big data from bacterial cell images, compared to conventional machine learning, using hybrid deep learning with LSTM, ResNet, and 1D-CNN.
Other illumination sources such as halide lamps, which tend to be more stable and less noisy than quartz tungsten halogen are also being explored. To shorten exposure rates and time for data acquisition, development and integration of sCMOS sensors is being discussed due to their higher sensitivity. The goal of these investigations is to transition from detecting isolated cells to those within a food matrix environment and enabling use of the technology in in-line production inspection environments.
The technology’s ability to dynamically change spectral range and bandpass capability mean that one instrument can be configured for numerous pathogens. Changes can be applied during quality control and inspection to simultaneously optimize accuracy and reduce capture time, in some instances reaching real-time. Cost advantages of the technology relative to other hyperspectral solutions also vastly improves access.
ACKNOWLEDGEMENTS
The authors would like to thank their industrial and government partners at Neogen Corporation for their assistance in providing the pathogen samples and data collection efforts to the team at USDA ARS in Athens, GA.
REFERENCES
1. R. L. Scharff, J. Food Prot., 75, 1, 123–131 (2012); doi:10.4315/0362-028x.jfp-11-058.
2. See https://bit.ly/HyperspectralRef2.
3. Y. Hiraoka, T. Shimi, and T. Haraguchi, Cell Struct. Funct., 27, 5, 367–374 (2002); doi:10.1247/csf.27.367.
4. F. C. Sung Yulung and S. Wei-Chuan, Biomed. Opt. Express, 8, 11, 5075–5086 (2017); doi:10.1364/boe.8.005075.
5. J. Lever, M. Krzywinski, and N. Altman, Nat. Methods, 14, 7, 641–642 (2017); doi:10.1038/nmeth.4346.
6. See https://bit.ly/HyperspectralRef6.
7. See https://bit.ly/HyperspectralRef7.
8. R. Kang, B. Park, M. Eady, Q. Ouyang, and K. Chen, Sensor. Actuat. B-Chem., 309 (2020); doi:10.1016/j.snb.2020.127789.
About the Author

Alexandre Fong
Director, Hyperspectral Imaging
Mr. Fong is Director, Hyperspectral Imaging at HinaLea Imaging. He was previously Senior Vice-President , Life Sciences and Instrumentation and Business Development at Gooch & Housego and held technical and commercial leadership positions at ITT Cannon, Newport Corporation, Honeywell and Teledyne Optech. He holds undergraduate and graduate degrees in Experimental Physics from York University in Toronto, Canada, an MBA from the University of Florida and is a Chartered Engineer. Mr. Fong is a published author and lecturer in the fields of precision light measurement, life sciences imaging, remote sensing, applied optics and lasers. He has served on the board of the OSA as well as Chair of the Public Policy Committee, Chair of the OSA Industry Development Associates and Contributing Editor to Optics and Photonics News, he is also an active member of SPIE as a former member of the Financial Advisory Committee and the International Commission on Illumination (CIE). Alex is the current president of the Florida Photonics Cluster.
Bosoon Park
Research Scientist, USDA
Bosoon Park, Ph.D., is a research scientist at the U.S. Department of Agriculture (USDA) Agricultural Research Service (ARS; Athens, GA).
George Shu
Principal Systems Engineer, HinaLea Imaging
George Shu, Ph.D., is principal systems engineer at HinaLea Imaging/TruTag Technologies (Emeryville, CA).
