Diagnostics/Optical Coherence Tomography: Light source calibration for accurate depth readings from FD-OCT
MARCUS DUELK
Fourier-domain optical coherence tomography (FD-OCT) is a coherence gating technique. It acquires, as a function of optical wavenumber, the interferometric signal generated by mixing backscattered light from the sample with reference light at a fixed group delay. Back-reflection or backscattered light from samples at different delays generates oscillations or fringes in the interference spectrum. Increased delay produces higher oscillation frequency in the interference spectrum. It is then possible to obtain depth-scan information (magnitude and positions of the scatterers) using an inverse Fourier transform (FT) of the interference spectrum. (The basis for this is the Wiener-Khintchine theorem between the auto-correlation and the spectral power density.)
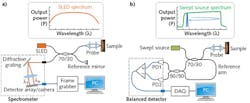
The two primary implementations of FD-OCT—spectral-domain (SD-OCT) and swept-source (SS-OCT)—are distinguished by the type of light source and detector used. Like the older time-domain OCT, SD-OCT employs a low-coherence broadband source such as a superluminescent light emitting diode (SLED), but relies on a spectrometer to disperse the interferometric signal spectrum in the detector arm across an array of detectors. In SS-OCT, a single detector acquires the interferometric signal by temporally sweeping a narrow-line source over a broad spectrum. Both implementations involve an inherently nonlinear sampling process in optical frequency (ν=c/λ) or wavenumber space (k-space; k = 2π/λ). For this reason, extracting accurate depth-ranging information requires calibrating frequency or k-space to obtain uniform k-space interference spectrum samples prior to inverse FT.
Spectral domain considerations
SD-OCT systems use a spectrometer and linescan camera (photodiode array) to measure the interferometric signal that is generated with a broadband light source and an interferometer (consisting of sample and reference arms). The spectrometer typically includes beam-alignment optics, a diffraction grating, and a line-scan camera with evenly spaced photosensitive pixels. The grating disperses the input spectrum according to the grating equation in air:
where m is the grating's diffraction order, f is the spatial frequency, λ is the wavelength, φ is the incident angle, and Θ is the diffraction angle. One readily observes that the diffraction angle of light dispersed by the grating is a nonlinear function of wavenumber k = 2π/λ. Therefore, the spectrum recorded by the line-scan camera is unevenly spaced in k.
Current practice involves interpolating the measured spectral interferogram and rescaling the data into the wavenumber-domain prior to performing the inverse FT. Though computationally intensive, this process effectively corrects the unequal wavenumber spacing between pixels and preserves the OCT image resolution. This rescaling process cannot, however, correct a second problem, namely that the spectral bands integrated by the pixels of the detector array are unequal in bandwidth, leading to increased fall-off of the OCT signal with imaging depth.
Swept-source considerations
In SS-OCT, the narrowband, wavelength-swept laser provides spectral encoding in time, and spectral information is obtained by recording the transient interference signal. The nonlinear property in this case arises from two origins:
First, the wavelength-selective elements in the swept lasers, such as those based on Fabry-Perot filters or diffraction gratings in resonant or polygon scanners, have the drive signal (i.e., voltage) proportional to the change in wavelength rather than in optical frequency. Therefore, similar to the case of SD-OCT, one requires a correction for the conversion from wavelength (λ) to frequency (ν) using ν = c/λ.
Second, the scanning mechanisms in these optical filters typically consist of piezoelectric, electrostatic, micro-electromechanical systems (MEMS) actuators, or galvanometers, and have different limitations on scan linearity and consistency over time and operating conditions. Especially for high-sweep frequencies, the scanning signal may be restricted to sinusoidal pattern that produces even more pronounced nonlinear sweep operation.
To overcome this nonlinear spectral sweep, two k-space calibration techniques are usually considered: direct k-clock sampling and linear temporal sampling, followed by software recalibration as used in SD-OCT.
Some key parameters relevant to baseline performance measure include linewidth or coherence length of the swept laser, sampling intervals, detection bandwidth, and noise-equivalent bandwidth.
Of the basic laser source parameters—linewidth, sweep range, and power—the instantaneous linewidth (δλ) or coherence length (lc) is of prime interest to understanding laser operation and hence imaging performance. Furthermore, in practical SS-OCT imaging implementation, imaging depth is inherently governed by two parameters:
- The source's finite linewidth δλ in wavelength or δν in frequency (where δλ = –c/v2δλ), which leads to a sensitivity fall-off with imaging depth; and
- The spectral sampling interval (dk), which limits the observable imaging range.
Assuming a Gaussian spectral lineshape, the coherence length is related to the laser dynamic linewidth through the relation:
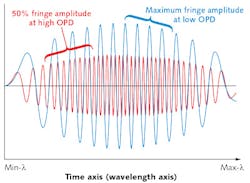
where λ0 is the center wavelength. Here, the coherence length is defined as the half-width at half-maximum (HWHM) of the coherence function. For swept-wavelength lasers, the instantaneous linewidth tends to vary across the swept spectrum, owing to wavelength dependence of the cavity parameters and dynamics. Because characterizing the instantaneous linewidth of rapidly swept lasers is difficult and mapping accurate time-wavelength relation between successive sweeps is necessary, two indirect approaches are typical. One method is to deduce coherence length by measuring the interference fringe amplitude as a function of the optical path length difference (OPD) with a calibrated Michelson interferometer (MI) or Mach-Zehnder interferometer (MZI) (see Fig. 1). This process produces a set of time-domain (wavelength-domain) fall-off curves. The coherence length as a function of wavelength is then defined as the OPD at which the corresponding interference fringe amplitude drops to half of its maximum value (at OPD = 0). Because OCT imaging is based on backscattering, the OPD corresponds to twice the imaging range dR.
Figure 2 illustrates the fringe amplitude vs. sweep time (wavelength) at two OPDs. The minimum reference OPD is typically 0.1–0.2 mm as the fringe pattern practically disappears at the exact zero-path length difference. The 50% fringe amplitude is obtained as the OPD is increased toward the coherence length. Note that because of nonlinear sweep, the wavelength axis must be calibrated properly.This time-domain (wavelength-domain) approach allows characterization of coherence length variation across the entire swept spectrum. Figure 3 shows a sample plot of coherence length as a function of wavelength for a bi-directional 1300 nm swept source at 40 kHz A-scan rate—its average optical sweep power at the fiber output is 20 mW with a peak power of ~40 mW. The laser shows high sweep symmetry with an instantaneous coherence of up to 10–12 mm for up- (short-to-long wavelength sweep) and down-sweep (long-to-short). Note that laser cavity dynamics and alignment may cause coherence characteristics to differ by sweep direction, and extra engineering effort may be required to equalize the amplitude (and noise) fall-off for bidirectional swept sources.
Average coherence
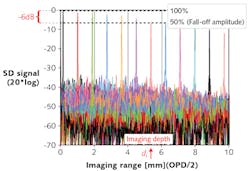
Often, it is convenient and useful to provide an average coherence of the swept source, which also accounts for phase fluctuations in the sweep. Average coherence length is derived by calculating the point-spread functions (PSF; i.e., system's impulse response) from the "k-space re-mapped" interference spectrum through inverse FT at incremental imaging range (dR = OPD/2) or OPD positions. The fall-off of peak PSF amplitudes as a function of imaging range or OPD can be considered as a measure for the average coherence property of the source over the sweep. This "spatial-domain method" has the benefit of providing axial resolution and information about the accuracy of the k-space sampling step. The average coherence length defined at 50% fringe fall-off corresponds to the OPD, at which the optical PSF (PSFo) amplitude falls off by 50% (i.e., 3 dB fall-off as defined by 10∙log10(PSFo)), or the electrical PSF (PSFe) falls off by 6 dB (defined by 20∙log10(PSFo) resulting from photodetection process). For convenience, Fig. 3 illustrates a commonly used relationship for reference.Coherence length vs. imaging depth
It is critical to understand that the coherence length is a performance parameter of the source, while the imaging depth is a performance parameter of the SS-OCT imaging system. While most system vendors specify a minimum coherence length (amplitude fall-off) of the swept source, the imaging performance of the OCT system is given by the SNR fall-off behavior of the source and of the entire system, including linearization algorithms. It is commonly expected that the 6-dB SNR fall-off (imaging depth) is identical to the 6 dB amplitude fall-off of the source, which is most often not the case. The imaging depth and hence the required coherence length or SNR fall-off is typically dictated by the application. For example, retina OCT imaging requires an imaging depth of 3–4 mm while anterior-chamber imaging needs an imaging depth of 7–8 mm, similar to endoscopic OCT applications where an imaging depth of 5–10 mm is often required.
Central to this discussion, to achieve maximal SNR and axial imaging resolution, the digitally sampled SS-OCT spectral interferogram must be evenly spaced by dk in the frequency or k-domain before inverse FT into an A-scan. This spectral sampling interval (dk) determines the maximum sampling depth zmax and is given by the Nyquist criterion as:
where dλ is the sampling interval in wavelength. For example, for a wavelength λ = 1310 nm and dλ = 0.1 nm, zmax = 4.3 mm (the single-sided imaging depth). Note that dλ is typically broader than δλ, and when dλ = δλ, zmax = di, the -6 dB PSFe is the fall-off distance. However, one can certainly sample at a finer resolution than the linewidth to get deeper imaging range.
Final notes
One note on the inherent "complex conjugate ambiguity" artifact: In FD-OCT, the Fourier transform of the real-valued spectral interferometric signal is Hermitian symmetric. As a result, sample reflectors are at a positive displacement with respect to the reference reflector being superimposed on those at a negative displacement. Retrieval of the complex interferometric signal can effectively double the imaging depth by removal of the complex conjugate ambiguity.
To facilitate real-time k-space recalibration and imaging, powerful computing support is essential. One useful approach is to incorporate data acquisition (DAQ) systems featuring field-programmable gate arrays (FPGAs) or graphics processing units (GPUs) so that pre-processing—and a certain amount of post-processing—can be done on the DAQ card. The processed data is then shuffled over a sufficiently fast interface bus (e.g., PCI or PCIe, Ethernet, CameraLink, etc.) to a host PC that is responsible for final processing and real-time display of the OCT data (e.g., B- or 3D volumetric scans). Beware, though: Displaying real-time OCT data may challenge typical central processing units (CPUs) or GPUs, so this option requires a sufficiently powerful host PC.
Marcus Duelk is chief technology officer at Exalos, Schlieren, Switzerland; www.exalos.com.


