Atmospheric analysis guides laser communication efforts
Atmospheric analysis guides laser communication efforts
M. J.
A space-to-Earth optical communication link requires a good understanding of the atmosphere because the laser beam has to propagate through it. The atmosphere not only attenuates the light wave but also distorts and bends it. Attenuation is primarily the result of absorption and scattering by molecules and particulates suspended in the atmosphere. Distortion, however, is caused by atmospheric turbulence through index-of-refraction fluctuations. Attenuation affects the mean value of the received signal in an optical link, whereas distortion results in variation of the signal around the mean.
Often, attenuation, or in the extreme case, cloud cover, can be the limiting factor in an optical communication link through the atmosphere. This article describes a user-friendly database created using Microsoft Access to analyze atmospheric transmission data. We also have completed development of a program to analyze direct-detection optical communication links (see "Spreadsheet helps analyze optical links," p. 140).
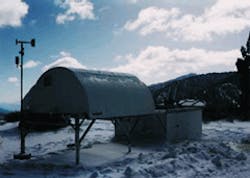
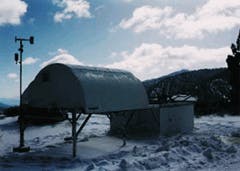
The atmospheric visibility monitoring (AVM) project was initiated by the Optical Communications Group at the Jet Propulsion Laboratory (JPL; Pasadena, CA) to determine experimentally the statistics of atmospheric transmission at different optical frequencies. As part of the project, three AVM units were built and deployed around the southwestern USA (see photo). Using calibrated telescopes, these AVM systems measure intensities of known stellar objects to determine atmospheric attenuation. Postprocessing of the collected data provides atmospheric visibility statistics. Such data are necessary to determine, for example, the probability with which data can be relayed back to Earth from satellites or spacecraft using laser communications. Atmospheric transmission data from multiple sites will be helpful in determining the probability that at least one of several sites will see a spacecraft`s downlink.
System description
Each of the three AVM systems in operation is a self-contained autonomous system, in an 8-ft-long ¥ 8-ft-wide ¥ 8-ft-high enclosure, that continuously observes selected stars and collects data. At the heart of each system is a 386-based computer that controls system parameters and components such as telescope motion, cameras, and filter wheels. Stars are observed through a
10-in. f/10 telescope with one of six filters--three narrowband filters at 532, 860, and 1060 nm and three broadband astronomical filters with center wavelengths of 540, 700, and 860 nm. Star intensities are recorded using a cooled, slow-scan CCD camera. In addition to star intensities, the AVM systems record weather information such as temperature, wind speed, and humidity.
The AVM stations are programmed to observe one star out of three for 15 minutes at a time. The three stars are selected so that each AVM telescope observes the stars as they rise and tracks them until they set. Normally only one of the three stars is up at any given time, which ensures that the same star is usually observed from all three sites, giving the needed site-diversity data. During each 15-minute period, six images of the stars are taken with the six different filters. Each image is stored with weather and system status information. At any given site, about 550 observations are made each day.
Each day, a computer at the JPL calls the AVM PC over standard phone lines and picks up the data collected during the previous 24 hours. A typical day`s data for each site are about 1.4 Mbytes. At the end of each month, the data collected for that month are stored on a CD using a recordable CD player. Archiving data on CDs allows easy access to the data from any computer.
In-depth information on AVM hardware and operational details is available.1,2 Over the past year, we have also undertaken an effort to upgrade the computer, CCD camera, and software to increase system reliability.2
Data reduction
At the end of each month, all AVM data are archived onto a CD-ROM. At this point, the data are still in raw form and need to be "reduced" before entering into a database. Although many data fields are readily usable, many fields require further processing. The star image, for instance, must be processed before any useful data can be extracted.
This process is performed using the AVM Data Reduction Program. It begins by reading each observation file from the CD-ROM and processing the star image contained within. More specifically, the program correlates the image against an expected point-spread function (PSF). The program assumes that the PSF, or the long-exposure intensity distribution at the focal plane, is Gaussian because of atmospheric turbulence. The correlation process yields the location of the star inside the image. The program then calculates the background noise of the image by averaging the pixel values around the border. This amount is subtracted from all the pixels so that the contribution from dark or background noise is reduced. By summing the pixel values in the neighborhood of the star`s center, we obtain the desired information, that is, a number proportional to the total collected star energy.
Single line of text
The overall task of the AVM Data Reduction Program is to convert each observation from an entire file to a single line of ASCII text. Each of these lines of text contains 38 tab-separated data fields, including star energy and flag number as calculated in the process described above. Other fields are either transferred directly from the observation file or converted via simple arithmetic means. In addition to reducing the overall size of the data, the reduction process also places the data in a format suitable for entering into the AVM Database Program. After several months of AVM data have been reduced, we load them into the Microsoft Access database.
The database contains the 38 data fields discussed above, plus two new ones--one that assigns each record a unique identification number and one that tells whether that particular record was taken during daytime or nighttime. The latter is necessary because the AVM system, in its current configuration, cannot distinguish stars from the bright solar background during daytime. Consequently, we only use data collected at night for the visibility cumulative distribution functions (CDFs).
The day/night information is calculated using the site location, date, and time. Before we can use the database, however, we need to know a set of calibration values to determine the atmospheric transmission from the measurements made by the CCD. The calibration values essentially provide what an AVM system would have observed if it were outside the Earth`s atmosphere (that is, in the absence of any atmosphere). Instead of calibrating the star and the AVM optical system spectral responses separately, it is convenient to extract the calibration values from the data.
Once the reduced data are loaded and the calibration table is set up in Access, the database is ready for use. The power of Access comes from the fact that one can easily and rapidly extract data by imposing certain bounds on one or more of the various fields. In database language, this process of selectively extracting data is called a query. In the process of using the database, numerous queries have been defined to access the most common information. The most important query is the one that generates a CDF of atmospheric attenuation given a location, filter, and time period. In Access, the query can be linked to a dialog box using Visual Basic for Applications, which makes obtaining CDFs trivial. In addition to the visibility statistics, the database contains queries that produce weather-related graphs at the AVM sites. These plots are obtained by feeding the results of a query to a Microsoft Chart function.
In the future, we plan to correlate atmospheric transmission to local meteorological measurements to build a simple model for predicting atmospheric visibility at other sites. o
REFERENCES
1. T.-Y. Yan, "Atmospheric transmission model through autonomous visibility measurement," SPIE Proc. 2123, 400 (1994).
2. M. Jeganathan and D.E. Erickson, "Overview of the atmospheric visibility monitoring (AVM) program," SPIE Proc. 2990, 114 (1997).
Three atmospheric visibility-monitoring stations have been established in the southwestern USA; this one is at Table Mountain near Wrightwood, CA.
Spreadsheet helps to analyze optical links
Free-Space Optical Communication Analysis Software (FOCAS) was developed at the Jet Propulsion Laboratory (JPL; Pasadena, CA) to provide mission planners, systems engineers, and communications engineers with an easy-to-use tool to analyze direct-detection optical communication links. The FOCAS program was implemented in a spreadsheet format using Microsoft Excel.
A host of predefined components allows an analyst to configure a link without having to know the details of the components. FOCAS replaces the FORTRAN program called OPTI. It has been designed to handle data rates from 1 Kbit/s to multigigabits per second, and some numerical integration and root-finding algorithms are required. Direct-detection features in the program include the following:
Modulation schemes
Reed-Solomon Code with arbitrary choice of code-word length and number of information symbols
Data on energy-storage-based lasers (for example, Q-switched and cavity dumped lasers) and current or externally modulated CW lasers
Data on transmitter and receiver gain for nearly diffraction-limited beam profiles calculated using the optimum Gaussian beamwidth-to-aperture-diameter for given secondary obscuration
Data on PIN photodetectors, avalanche photodiodes, and photomultiplier tubes including look-u¥tables for the wavelength-dependent quantum efficiency
Models for transimpedance and high-impedance preamplifiers that determine the pream¥noise-equivalent-current from the bandwidth required for the link and detector characteristics
Wavelength and zenith-angle-dependent atmospheric transmission data and wavelength-dependent sky radiance data used to achieve accurate estimates for different wavelengths
M. J.
Additional information
M. Jeganathan, G. S. Mecherle, and J. R. Lesh, "Development of the free-space optical comunications analysis software (FOCAS)," SPIE Proc. 3266 (1998).
MUTHU JEGANATHAN is a member of the technical staff in the optical communications grou¥at the Jet Propulsion Laboratory, California Institute of Technology, 4800 Oak Grove Drive, Pasadena, CA 91109; e-mail: [email protected].

