Spectroscopic line-scan systems open short-wave infrared applications
In conventional two-dimensional imaging, the total light reflected or emitted from each point on the surface of an object is measured and stored. In hyperspectral imaging and imaging spectroscopy, the intensity as a function of wavelength is stored for each point. The result is a three-dimensional "image cube."
The difference between the two forms of spectroscopic imaging is qualitative. Hyperspectral imaging usually refers to the capture of the intensity at several discrete wavelengths or wavelength bands while in imaging spectroscopy, a full high-resolution spectrum is captured. By mounting an imaging spectrograph on a two-dimensional short-wave-infrared (SWIR) focal-plane array, imaging spectroscopy can be applied to tasks such as monitoring a web process or assembly line, inspection of agricultural products, and moisture and plume analysis.
Recent advances in indium gallium arsenide (InGaAs) technology have produced commercial focal-plane arrays (FPAs) with as many as 640 × 512 pixels on a 25-µm pitch. Cameras incorporating these large arrays are readily available at prices reminiscent of scientific silicon CCD cameras. For the first time, high-resolution imaging spectroscopy is now possible in the SWIR (1.0 to 2.5 µm)—a wavelength band rich with spectral information.
Generating an image cube
Several techniques can be used to generate a spectral/spatial image cube. The simplest is to place a spectral bandpass filter over each pixel. This technique is the approach taken with color CCDs in which each "hyper pixel" consists of two green pixels, a red pixel, and a blue pixel. In this approach, there is a direct tradeoff between spatial and spectral resolution, and as a practical matter the number of wavelengths is severely limited.
The spectral resolution can be increased without sacrificing spatial resolution by placing a filter wheel or tunable filter in front of a two-dimensional CCD, CMOS sensor, or focal-plane array. Each frame contains the image generated from a single wavelength or wavelength band. In this approach, a high-spectral-resolution image (from 64 to as many as 1024 wavelengths) can take multiple seconds. This delay is acceptable as long as the object is stationary. It is not acceptable if either the camera is moving (aerial or satellite surveillance) or if the object is moving (web process control or objects on a conveyor belt).
One approach for generating a two-dimensional image of a moving object is to use a one-dimensional or line-scan camera. The frame rate of the line-scan camera is synchronized with the motion of the object so that each one-dimensional frame contains the image of a row in the final two-dimensional image. Each line-scan camera captures a single wavelength of information, so imaging multiple wavelengths requires multiple cameras. However, by using an imaging spectrograph in place of a standard lens and a two-dimensional camera in place of a line-scan camera, one can fabricate a hyperspectral line-scan camera in which each spatially one-dimensional frame contains a full optical spectrum.
Imaging with a spectrograph
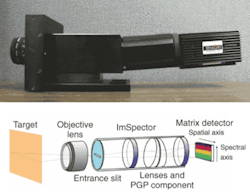
To build this two-dimensional system, an imaging spectrograph is placed between the objective lens and the focal-plane array. The imaging spectrograph consists of a transmission grating and optics to correct the spatial distortion of a conventional spectrograph. The result is that, in the direction parallel to the entrance slit, spatial information is preserved. In the direction perpendicular to the entrance slit, the pixels represent a high-resolution optical spectrum. This combination is, effectively, a spectral line-scan camera (see Fig. 1).
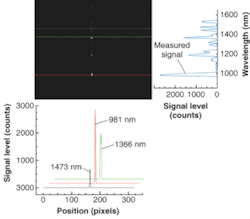
Such a camera system was used to record the output of a krypton pen lamp. In the direction parallel to the entrance slit, the slice contains an optical spectrum of the pen lamp (the pixels are calibrated in wavelength). In the direction perpendicular to the slit, the slice provides a beam profile of the pen lamp (see Fig. 2).
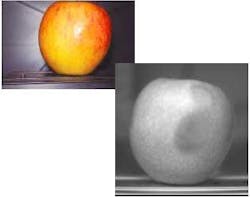
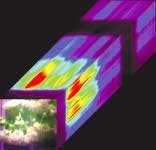
Why is this useful and why SWIR? In many process-control or inspection applications, objects or conditions look the same in the visible but different in the SWIR. One example is the detection of bruises on fruit. The bruises on an apple are not always apparent using visible light, but are very obvious in the SWIR (see Fig. 3). Another example is the ability to differentiate leaves from twigs in agricultural sorting applications (see Fig. 4).
In general, many applications such as quality control of agricultural products and pharmaceuticals, and the manufacture of paper, steel, and glass either involve the effects of water absorption (with peaks near 1.4 and 1.9 µm) or thermal imaging through glass at temperatures too low to be seen by silicon CCDs. Thus, a line-scan camera operating in the SWIR may have value.
Spectroscopic applications
Many spectroscopic process-control applications make use of a methodology known as chemometrics, defined by the International Chemometric Society as ". . . the science of relating measurements made on a chemical system or process to the state of the system via application of mathematical or statistical methods." In other words, without necessarily knowing the causal relationship between the state of the system and, in our case, the resultant optical spectrum, we can differentiate the known substances in the measurement from the unknowns, or the concentrations of an identified substance compared to a calibrated sample.
In a typical application, a process-control engineer would acquire full, high-resolution spectral data cubes of the process to be monitored or the product to be inspected. He or she would then correlate the property to be controlled or monitored with the measured spectra. Most processes or products can be controlled or monitored with relatively few wavelengths—typically no more than 16. Traditionally, once the wavelength bands of interest are identified, a custom imaging system had to be designed to take advantage of them. With modern InGaAs FPAs, this is no longer necessary.
The InGaAs focal-plane arrays (FPA) are available with 320 × 256 and 640 × 512 elements and featuring snapshot-mode exposure, multiple nondestructive readouts, and dynamic windowing. In a snapshot-mode exposure, all of the pixels are exposed simultaneously then read out sequentially. This is essential for the imaging spectroscopy we have discussed because it allows full spectra of all of the pixels in the line to be acquired at once from a moving object. The multiple readouts allow the image to be read out at high speeds. The 320 × 256 FPA, for example, can be read out at more than 280 frames/s with four outputs.
The dynamic windowing and nondestructive readout allow rapid implementation of chemometric analysis. Dynamic windowing allows inspection of regions of interest as small as 2 × 2 pixels and expandable in even numbers of pixels to be defined anywhere on the FPA. While the entire FPA captures an image, only the pixels in the region of interest are read out, vastly increasing the frame rate. With a nondestructive readout, an image can be captured and several regions of interest defined and then read out before the FPA is reset and the next image captured.
Consider a case in which the chemometric analysis has defined eight wavelength bands of interest and in the imaging spectrographic system these each correspond to four rows of pixels, each row having a spatial resolution of 320 pixels. Using a 320 × 256-element InGaAs FPA, a high-spectral-resolution line-scan image would be captured in a single snapshot exposure; then the eight-wavelength band of interest would be read out with full spatial resolution of 320 pixels faster than 2000 frames/s, which is critical for inspection of faster-moving objects.
MARTIN H. ETTENBERG is director of imaging products and MARSHALL J. COHEN is president of Sensors Unlimited, 3490 US Rte 1., Princeton, NJ 08540; e-mail: [email protected].


