A common requirement is the ability to sense the power level of light in a fiber. Whether to monitor the input and output signal to an optical amplifier or switch, to sense the absence of signal in protection network schemes, or any number of other uses, power monitoring is oftentimes a required feature.
Until recently the preferred sensing method was an optical tap coupler and a pigtailed photodiode. The typical tap coupler used is available in various tap percentages and efficiencies. The pigtailed photodiode is often indium gallium arsenide (InGaAs) but can be germanium (Ge) or silicon (Si) for some wavelengths and applications. The labor required for splicing these components together and the space required for fiber routing has driven the development of more integrated solutions.
Integrated tap sensors (ITSs) can be manufactured using a variety of different technologies, each having its own advantages and tradeoffs. Several styles of ITS have appeared on the market, each with specific performance limits and design considerations such as partial reflectors, fiber microbends, evanescent coupling, and integrated waveguides.
Partial reflectors
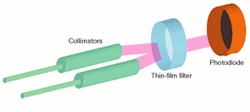
The construction of a partial-reflector ITS is similar to that of most coarse WDM components. The input and output fibers are mated to a dual collimator that is focused on a partially reflecting thin film that is in front of the photodiode (see Fig. 1). The collimators and the thin-film filter establish a lower limit on insertion loss that can be reached with this type of construction.
FIGURE 1. In a partial-reflector ITS, input and output fibers are mated to a dual collimator focused on a partially reflecting thin film in front of the photodiode.
null
For applications in which the insertion loss budget can accommodate the higher loss these types of integrated tap sensors can be used. This is a very mature technology so the cost of dual collimators and thin-film filters has come down dramatically and flattened out in recent years.
Fiber microbends
When fiber is bent tighter than its minimum bend radius, a very small portion of the signal exits the core and enters the cladding (see Fig. 2). As long as care is taken during construction, stressing or damaging the fiber should not occur. The effect can be used to sense the amount of signal in the fiber because microbending the fiber and positioning a sensor at the bend can capture some of the light that leaks through the cladding. When there is sufficient signal within the fiber being monitored, the distance and position that the sensor must be from the core still allows enough light to fall on the photodiode to create a useful photocurrent. An advantage of this type of sensor is that most of the signal remains in the core of the fiber.
null
Evanescent fields
The waveguide formed by the core and cladding of the fiber is the safest place for the optical signal to be. Any time that the optical signal is completely removed from the fiber there is a risk of it not returning. This has motivated several developments such as the microbend and evanescent-coupling ITS that keeps the signal in the fiber.
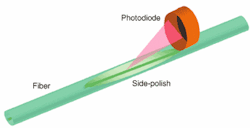
The ends of the fiber are obvious access points to the waveguide; the evanescent field is another access point. The evanescent field is the area just outside the core in the first few microns of the cladding. Polishing the fiber to within a few microns of the core can access this field (see Fig. 3). Until recently, providing low-cost, high-quality side-polished fiber was limited to more expensive components that required low insertion loss. With advances in manufacturing, high-quality ITS components can now be produced with side-polished fiber. Sensors built in this manner allow the optical signal to remain essentially untouched in the core of the fiber, while the evanescent field is sampled to reveal the average power in the signal.
FIGURE 3. Polishing a fiber to within a few microns of the core can provide access to the evanescent field.
null
Waveguides
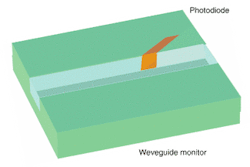
Some tap sensors utilize a waveguide and pick-off approach (see Fig. 4). Building an ITS from a waveguide allows a compact component when many fibers must be monitored. This approach can be used in combination with other functions on the waveguide or alone. Crosstalk must be guarded against in these components when the signals in two adjacent fibers differ by many orders of magnitude.
FIGURE 4. Building an ITS using a waveguide and pick-off approach provides compactness for applications in which many fibers must be monitored.
null
Optical and power-sensing performance
The combination of a tap coupler and photodiode is comparable to the ITS described above. Taking this combined or "black box" approach—with the three "ports" on the box being the input fiber, output fiber, and photocurrent output—allows a straightforward comparison.
An example to start from is a coupler and a typical pigtailed photodiode connected together. A typical 95/5 coupler may only have 91% of the incoming light exit one leg and 5% exit the tapped leg. The other 4% loss is internal to the coupler. With this information and the response of the photodiode the efficiency of the combination as a system can be found and compared to the ITS solutions available.
The most straightforward measure of efficiency is amps of photocurrent collected by the photodiode, per watt of light input to the fiber, for a given amount of insertion loss in dB. This is expressed as (A/W/dB). As a comparison, the A/W/dB of the above example typical 95/5 coupler and photodiode would be 0.1 A/W/dB. Other performance specifications can easily be separated into the optical signal path and the photocurrent response specifications.
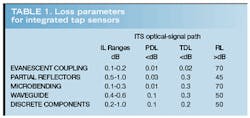
Signal-path optical specifications of most interest are insertion loss (IL), polarization-dependent loss (PDL), and temperature-dependent loss (TDL). Additionally, return loss (RL) and maximum optical power (MAXop) are parameters of the optical signal path that may be dependent on other parameters. Depending on use, both chromatic, and polarization mode, dispersion as well as group delay may also affect fitness for use. Typical values for loss parameters for the technologies discussed are shown in Table 1. The maximum insertion loss of an ITS is typically specified within the range listed.
The photocurrent of the ITS at a given power level should grow linearly with increased power in the fiber. Response linearity is often specified as either the least squares fit to a line or the percentage of difference from a line over a given input power range. The upper end of response linearity is typically due to either the photodiode saturation or the maximum power that the tap sensor's optics can handle. The lower end of the linear range is a function of biasing mode, temperature, and the design of the amplifier electronics.
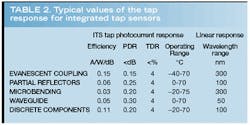
The polarization state of the signal in the fiber and operating environment can also change the photocurrent of the ITS. Polarization- dependent response (PDR) and temperature-dependent response (TDR) modify the photocurrent response.
Depending upon the application being considered, these parameters must be carefully studied to determine which technology provides the best cost/performance benefit to the user. Typical values of the tap response for the technologies discussed are shown in Table 2.
Physical performance considerations
Mechanical and environmental performance requirements are often dictated by the end-user application. Physical size among the many ITS solutions is in the same range with some technologies offering arrays and single-fiber solutions while others have limited offerings. Fiber and signal-pin configurations vary among the many types of ITS and are usually dictated by the method used to sample the signal. Partial-reflector components typically have the input and output fibers on the same side, while microbending and evanescent coupling have the input and output fibers on opposite sides. Either configuration is easily accommodated by a creative board layout.
Signal directionality
The use of a tap coupler and a photodiode for power-monitoring applications only allows sensing of the input signal from one direction. Some ITS technologies allow sensing in both directions, which is useful for optical switch or routing applications where the signal can be coming from either direction. The difference in sensitivity to signals from the opposite direction is referred to as directionality. Directionality values vary from less than one dB for devices that are bidirectional to 40 dB for directional devices.
Other factors
Depending on the system architecture, a single dB of signal loss can cost between $200 and $500 in overall system costs. With signal monitoring becoming more pervasive as handoffs are made from system to system, monitoring the signal with minimal impact to the insertion-loss budget is an absolute requirement. When comparing the ITS technologies discussed, it is useful to keep in mind that the more mature methods have reached a plateau in both cost and performance. Partial-reflector and microbending technologies have stabilized in both cost and performance while manufacturing gains in waveguide and evanescent coupling are on a steep ramp.
Each system architecture has slightly different design limits. Some specific system needs, such as efficiency, insertion loss, and optical damage thresholds, may begin to quickly narrow down the choice of what model of ITS to select . Other than polarization-dependent response most of the factors that affect the stability of the photocurrent can be designed around (see "Wavelength ranges and other considerations," p. S10; "Mode choice," above). PDR shows up as a signal variation that cannot be discerned from signal strength variation. In systems with PM fiber and PM ITSs there is no PDR to contend with.
Failure modes may also become of great interest. If the failure modes cause the signal to cease on its path then the system will not still operate even at reduced efficiency. Additionally, if the amplifier electronics or the ITS itself joins multiple photodiodes together in a common cathode arrangement, when one of the photodiodes fail the others may no longer operate correctly.
The ultimate choice of ITS for each application involves the tradeoffs of performance and cost. Both of these tradeoffs involve more than the performance or cost of the component. More expensive electronics to accommodate a low photocurrent or a more powerful optical amplifier to overcome losses can quickly cause an otherwise inexpensive component to raise the overall system cost. With a wide choice of ITSs on the market, knowing the capabilities of each should make the design task more straightforward.
WILLIAM J. DE COSTA is director of marketing at Oluma, 5803 Newton Dr., Suite B, Carlsbad, CA 92008; e-mail: [email protected].
Wavelength ranges and other considerations
If a specific model of ITS is to be used for monitoring a wide range of wavelengths both the wavelength-dependent loss and the wavelength-dependent response from the photodiode need to be taken in to consideration. Because of photodiode sensitivities and coupling efficiencies, the output of the photodiode varies depending on the wavelength of light in the fiber.
In many applications such as amplifiers, optical add/drop-multiplexer feedback loops, and simple signal monitoring, this is often not an issue. In some system architectures, any one of many different wavelengths could pass through the ITS and a real power level will have to be determined. This can be done in software or by wavelength flattening the ITS response. Flattening is usually done only over the region of interest because of the efficiency lost as more wavelengths are accommodated.
In addition to the photocurrent response, the optical-signal path in waveguides and reflective sensors can also have a wavelength-dependent insertion loss and a limited bandwidth. In systems in which all future wavelengths are already known this may not be an issue, but in optical crossconnects and other wavelength-expandable systems this should be taken into account.
