John R. Gilchrist, Jagdish Rebello, Dominick Lanzisera, and Jon Noonan
As one of the pre-eminent measurement techniques in scientific research, optical spectroscopy has rapidly evolved to meet the demanding needs of its users. In its most basic form, the individual components of an optical spectroscopic system consist of a light source, a light-dispersive medium, and a detector; advances in all three categories have allowed tremendous gains in the ability to obtain data.
Light sources have grown from simple blackbody elements to advanced sources such as arc lamps and lasers. Dispersive elements, specifically spectrometers, have become more efficient as fabrication methods of gratings and mirrors have improved. Perhaps the most dramatic improvements in spectroscopic tools in the past decade have been in the advances of detector technology. The detectors used in optical spectroscopy convert the radiant power in the measurement to an electrical signal that can be processed, recorded, and displayed.
There are two main categories of detectors: single channel and multiple channel. Single-channel detectors are single-element detectors that accept light through the exit slit of the spectrometer. The entire bandpass through that slit counts toward the generated signal. A single-channel detector thus produces a spectrum by rotating the grating and recording one data point for each grating position.
By contrast, multichannel detectors allow a user to collect several data points simultaneously without moving a grating or any other part of the spectrometer. This arrangement provides for much more efficient data collection than the single-channel counterparts because large amounts of spectral data can be collected in a single exposure. First developed primarily for the visible region of the spectrum, multichannel detectors enable collection of hundreds, and in some cases thousands, of data points in a single exposure.
No exit slit is used on the spectrometer; instead, the dispersed spectrum is incident on the detector, which consists of several individual, evenly spaced small detection elements. The most popular multichannel detectors are charge-coupled devices (CCDs), which are typically two-dimensional arrays made of silicon with several hundred elements—or pixels—arranged in a rectangle. For spectroscopy, the longer side of the rectangular array is arranged to coincide with the dispersed spectrum.
Scientific-grade CCDs exhibit high responsivity from the near-ultraviolet to the near-infrared (NIR) region of the spectrum—200 nm to 1.1 µm. At longer wavelengths, the photon energy is less than the silicon bandgap, and the silicon thus becomes transparent to the incident photons. However, III-V materials such as indium gallium arsenide (InGaAs) have a lower bandgap and can absorb the NIR photons.
For this reason, InGaAs detector arrays are proving very useful between 0.9 and 1.7 µm. By changing the alloy composition of the detector material, the wavelength response can be extended up to 2.2 µm, but this wavelength extension comes at the expense of higher noise.
Understanding signal-to-noise ratio
The InGaAs arrays used in spectroscopy are arrays of individual photodiodes on silicon CMOS readout multiplexer circuits. These are typically linear, one-dimensional arrays, consisting of 128, 256, or even as many as 512 elements in some cases, and providing very high sensitivity at wavelengths up to 2.2 µm. For this reason, in low-light-level spectroscopic applications, it is very important to understand the various noise sources in a measurement with an InGaAs array.
The individual InGaAs photodiode elements in an array have independent capacitive transimpediance preamplifier circuits. Because of limitations in current microlithographic processes, each amplifier circuit in the array is slightly different and applies its own bias voltage. The result is minute differences in the dark current of each element, leading to a predictable and repeatable noise source known as fixed-pattern noise.
This noise source is a strong function of both the integration time and the array operating temperature and can be reduced by cooling the array with either thermoelectric or liquid-nitrogen cooling. In addition, this fixed-pattern noise is repeatable and can be eliminated by subtracting a dark acquisition of the same integration time as the spectrum of interest.
Other sources of noise in an InGaAs array measurement include read noise, which is electronic noise that occurs when the elements are read out, and dark signal, which is the response of the detector to the blackbody emission of the room-temperature ambient. This dark signal and the useful signal also contribute to the shot noise associated with the measurement, which is equal to the square root of the total signal.
While reducing the sensor temperature can reduce the total noise of an array, care must be taken to avoid cooling the array more than is necessary. This is because the long-wavelength response cutoff decreases with detector temperature at approximately 1 nm for every degree kelvin. In practice, despite these diverse sources of noise, measurements with an InGaAs array are often shot-noise limited (see Fig. 1).
Systems and software
For use in spectroscopic applications, the InGaAs array detectors must be mounted onto an imaging spectrograph. Such spectrographs have corrected optics that disperse the spectral information across a flat field in the exit plane of the instrument. This dispersion allows the array detector, mounted at the exit plane, to collect large amounts of spectral information in a single exposure.
For spectroscopic applications, it is very important for the detector and the spectrograph to be controlled by a single dedicated spectroscopic software package. In most spectroscopic applications, the data from the InGaAs array need to be specified as a function of wavelength. By itself, however, the array cannot differentiate between the wavelengths of light incident upon it—this must be calculated by the software.
Because different spectrometer and grating combinations have different spectral dispersions, the spectrum over the IR array will change with the varying conditions. If the dispersion of the spectrograph and the grating position are known, the software can calculate wavelength-dependent data from the NIR array.
Proper spectroscopic software should be able not only to read the data and convert it into a useful format (for example, wavelength versus counts) but also to change the state of the devices to make the appropriate measurements. For a movable grating spectrometer, the software must be able to change the center wavelength to allow measurement of the area of interest. For the InGaAs array, gain selection via the software is essential.
The most complete spectroscopic packages not only read the data in the desired format but also have extensive provisions for data analysis and display. In the examples that follow, integrated systems consisting of an InGaAs linear array, spectrometer, and complete spectroscopic software provide data to satisfy varied areas of spectroscopy.
Putting NIR spectroscopy to work
High-performance spectroscopic systems with cooled InGaAs array detectors are now being used for low-light-level detection in a variety of applications such as photoluminescence measurements and Raman spectroscopy. In these applications, the multiplexing advantage afforded by these sensitive spectroscopic array systems allows for a complete spectral measurement in a fraction of the time when compared to a single-channel detector.
Raman spectroscopy. Raman scattering is an inelastic light-scattering process that is increasingly being used in the materials-processing industry as a nondestructive technique for phase identification, as well as for stress, mid-range order, and orientation measurements in solids. In the pharmaceutical industry, Raman spectroscopy is an attractive nonintrusive method for identifying small differences in formula modifications. These applications make Raman spectroscopy a useful online technique during different manufacturing processes.
Traditionally, visible Raman spectra have been obtained with a krypton- or argon-ion gas laser as the excitation source and a photomultiplier tube (PMT) or CCD as the detector. The Raman signals can be very weak and thus might require long exposures to achieve acceptable signal-to-noise performance.
Excitation with these visible laser sources also can produce significant amounts of background fluorescence that can drown out the Raman signal from many samples. The fluorescence background can be reduced by using longer-wavelength diode (785 nm) and Nd:YAG (1.06 µm) lasers. Unfortunately, because of the diminished responsivity of a PMT or a CCD detector in the NIR region of the spectrum, the recorded intensities of many important Raman signals (for example, the CH and OH vibrational bands) are greatly degraded when working with these detectors.
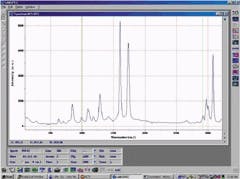
With its lower bandgap energy, an InGaAs array detector is very sensitive in the NIR region and can detect even the CH and OH bands when a sample is excited with an IR diode laser or a Nd:YAG laser (see Fig. 2).Photoluminescence. Photoluminescence spectroscopy is another simple and powerful technique that is widely used in the semiconductor industry for material characterization. In photoluminescence measurements, a sample is irradiated with a visible light source that stimulates the solid-state material to an excited electronic state. As this excited state relaxes to the ground state, it emits light at a wavelength dependent on the bandgap of the material.
This technique thus provides information about the material bandgap, impurity content, homogeneity, and thickness of the epitaxial layers. For example, in an indirect bandgap material such as silicon, the wavelength of the photoluminescence emission is strongly affected by defects in the material, and thus this technique can be used to characterize the silicon—even under active conditions.
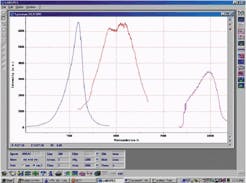
In conventional photoluminescence measurements, a scanning spectrometer equipped with a single-element InGaAs detector is used for analyzing the emission from a sample. The drawback with this is that a significant amount of time is required to collect a single spectrum. With an InGaAs array detector mounted onto an imaging spectrograph, a large amount of spectral information can be collected simultaneously (see Fig. 3).Other applications include singlet oxygen fluorescence monitoring, IR laser-diode characterization, and photoreflectance. The number of applications is growing steadily because InGaAs NIR arrays make previously difficult applications more feasible. As part of an integrated system including spectrometer and software, InGaAs arrays will continue to be important instruments to the infrared spectroscopist.
JOHN R. GILCHRIST is the director of sales and marketing, JAGDISH REBELLO is the detector product manager, and DOMINICK LANZISERA is an applications engineer in the spectroscopy systems group, and JON NOONAN is Web master at JY Horiba, 3880 Park Ave., Edison, NJ 08820; e-mail: [email protected].


