BEAM PROFILERS: Fiber lasers pose special challenges for beam profiling
DERRICK PETERMAN
Fiber lasers are increasingly used to mark, machine, melt, or otherwise modify materials with progressively more intricate patterns and shapes. Such applications use lasers ranging from a few watts to a few kilowatts of power, and a key advantage of fiber lasers in such applications is a more Gaussian beam profile than other lasers of comparable power. Thus, effective beam profiling will play an ever more important role in evaluating fiber lasers, predicting their effects on associated optics, and helping fiber-laser technology reach its full potential.
Beam profiling is a generic term for measuring the spatial energy distribution of a beam. The profile can provide qualitative information, such as visual inspection of “hot spots” or an overall view of laser beam quality. The beam profile is also used to extract quantitative information, such as beam size, beam position, or M2. Quantitative data is especially important for lens alignment in optical assemblies and for quantitative characterization of lasers. Several profiling tools are used to obtain these qualitative and quantitative data.
Sensor arrays
Silicon-based CCD and CMOS detector-array cameras are ubiquitous in optical labs and on optical-manufacturing floors. They offer a convenient choice for laser profiling, but the silicon sensors cannot be exposed to the output of lasers designed to machine steel and plastics, so beam attenuation is required to protect the sensor from damage. Also, any meaningful profile must be produced below the saturation point of the detector, which requires additional beam attenuation.
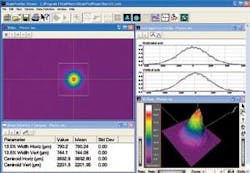
FIGURE 1. In typical data output from a silicon array CCD camera, linear profiles are generated along the horizontal and vertical axis of the profile at the upper right, and a false-color 3-D image of the profile can be generated using visualization software. Quantitative parameters from the beam profile are also extracted in tabular form.
Attenuating a laser beam of 1 W or higher energy requires reflective attenuation-absorptive attenuators will heat up substantially, causing damage or thermal blooming effects that distort the beam profile. Typically, beam powers of 1 to 1000 W must be attenuated by 9 to 12 orders of magnitude with silicon-based detectors, bringing into question the degree to which the attenuated beam still represents the original. Careless attenuation schemes can have unfortunate consequences, although it is possible to reasonably preserve the beam integrity (see Fig. 1).
Array detectors offer the advantage that a two-dimensional (2-D) picture is generated from the beam that provides intuitive and qualitative information, and also provides a good means of determining hot spots in the beam. For quantitative information such as beam size or beam position, sensor arrays are usually not the best choice for the most accurate measurements, however. The suitability of an array detector also depends on the beam size being profiled.
Beams larger than 100 µm, for example, can be analyzed within 3% to 5% accuracy using silicon detector arrays. More accurate measurements are obtained with moving-aperture profilers. Silicon detectors operate between 190 and 1100 nm, while many fiber lasers operate above 1100 nm, so other types of array detectors must be used for beam profiling-indium gallium arsenide (InGaAs) arrays, vidicon detectors, and pyroelectric arrays, for example, which have pixel dimensions on the order of a few tens of microns. While these detectors have been used successfully for high-power beam profiling, the pixel sizes of such array detectors can require beam sizes as large as 500 µm or more to provide meaningful data, and cameras based on these detectors can be expensive.
Moving apertures
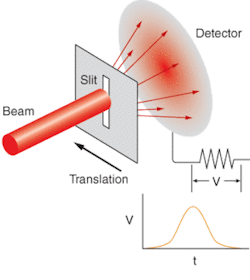
Moving apertures offer several advantages for high-power lasers. Moving-aperture profiling involves moving a slit, knife-edge, or pinhole through a beam and detecting the light passing through the moving aperture. The detector signal is compared to the aperture position to determine the profile. Slit apertures are easier to use than pinhole apertures and provide better spatial resolution than knife-edge apertures. In slit apertures, the beam profile is determined by comparing the slit position with the detector signal, which results in highly accurate beam-size measurements.1 Two slits mounted at right angles on a spinning drum generate orthogonal profiles (see Fig. 2).
FIGURE 2. A scanning slit profiler involves a slit translated through a beam, which allows light to fall onto a detector. The voltage signal of the detector versus time, which is correlated to the slit position, determines the beam profile along the slit translation direction.
Slit apertures are also physical attenuators and let only a small amount of light through, which is beneficial in measuring high-power sources because only a small piece of the profile is exposed to the detector at one time. With a pyroelectric detector and reflective slit apertures, beams up to a few kilowatts can be profiled directly without any optical beam attenuation, which would add complexity and can introduce errors. Furthermore, slit profilers measure beam size and beam position to submicron resolution, which cannot be achieved using sensor arrays. These profilers measure over a dynamic range of four to six orders of magnitude, which further adds to their flexibility. This is especially true at wavelengths above 1100 nm, where the available sensor arrays have pixel dimensions of a few tens of microns.
Slit-based profilers are well suited for M2 measurements-an important issue for fiber lasers, which typically have nearly Gaussian beams and deliver nearly diffraction-limited performance compared to other lasers operating at similar power. The measurement of M2 involves a series of beam-size measurements along the beam propagation to map out a beam waist created by a lens. A wide variety of beam power densities must be captured as the beam changes in size along the waist. The measurement of M2 requires beam measurements at many power densities and the high dynamic range of slit profilers makes them easy to use in mapping out the waist and generating the results.
A disadvantage of slit profilers, though, is that they cannot be used for lasers pulsed at repetition rates under 1 kHz. For fiber lasers pulsed below this rate, an array detector is usually required. And while orthogonal profiles do generate 2-D profile information, some 2-D spatial information is inevitably lost because of the nature of the slit profile.
Goniometric radiometers
Goniometric radiometers are commonly used as profilers to measure high-power laser beams that have a full angular divergence of 10° or greater. Many fiber lasers fall into this range. The beam divergence from a fiber, often parameterized by the numerical aperture (NA), is an important factor in determining the correct optics for shaping the beam to do useful work efficiently, and is therefore of great interest to many fiber-laser manufacturers. Mode-field diameter (MFD) of optical fibers is also of interest because it relates the coupling efficiency of fibers and is used to monitor fiber production processes.
Divergent sources are challenging to profile accurately. Attenuating the beam power of a divergent beam is undesirable because most schemes attenuate the beam edges more than the center as the beam diverges, which causes the beam to appear narrower than it really is. A divergent beam rapidly expands as it propagates through space, often making the beam size larger than any detector used in a profiling tool and requiring the use of beam-reduction optics to fit the beam onto the detector. Thus, a camera profile of a divergent source is difficult to implement and often gives erroneous results.
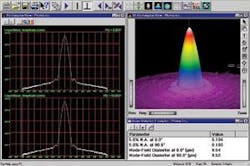
FIGURE 3. In a far-field goniometric scan of an optical fiber, two single-axis angular scans are generated on the left. Several angular scans are pieced together to generate the 3-D profile of the fiber, and the numerical aperture and mode-field diameter of the fiber is calculated from the far-field profiles.
Goniometric radiometers overcome these issues by generating an angular profile in which the test source is at the center of a circle and a detector is rotated at a fixed radius. The detector analyzes a small portion of the beam at any given time so high-power lasers are more easily characterized than with other methods, and with little or no attenuation. The detector is often mounted on the moving arm so there are no optics between the test source and the detector, eliminating one potential source for measurement error. Either the sample or the moving arm can be rotated to generate several angular scans that can be reconstructed to generate 3-D pictures of the test source (see Fig. 3).
While goniometric radiometers overcome the challenges of measuring divergent sources, the moving arms can produce a slow measurement. A technique for rapid goniometric scans involves generating single-axis scans in real time, and full 3‑D picture scans are produced. This technique has been proved in measurements of divergent laser diodes and of optical fibers of all types.2- 5❏
REFERENCES
1. T. F. Johnson and J. M. Fleischer, Applied Optics35(10) 1719 (1996).
2. D. Peterman and J. Guttman, Laser Focus World (July 2001).
3. J. L. Guttman, J. M. Fleischer, and A. M. Cary, Munich Laser Conf., Munich, Germany, June 2001.
4. J. L. Guttman, R. Chirita, C. D. Palsan, NIST Special Publication 953, Symp. Optical Fiber Measurement, 69 (2000).
5. J. L. Guttman, NIST Spec. Pub. 988, Symp. Optical Fiber Measurement, 33 (2002).
DERRICK PETERMAN is an engineer with Photon Inc., 6860 Santa Teresa Blvd., San Jose, CA 95119; e-mail: [email protected]; www.photon-inc.com.


