Photodiodes can help save apples and the planet
Food waste is a serious global problem, but it is even bigger than most people might think and continues to grow.
A recent study found that “approximately one-third to one-fourth …of food produced for human consumption was lost or wasted in 2014.”1 Most often, “lost” refers to losses in production, transport, and processing, while “wasted” covers food that is thrown away at retailers or households.
The scientists screened data from 121 countries and discovered an increase of 24% in food loss and waste (FLW) compared to data from 2004. In North America, FLW amounts to about three pounds per person each day. The U.S. Environmental Protection Agency (EPA) estimates that about 40 million tons or about 60% of food waste was sent to landfills in 2019.2
This raises a substantial environmental question: If all that organic material rots, how much climate gas does it emit? Within the study mentioned above, the authors calculated a fraction of 3.9% of U.S. greenhouse gas emissions attributed to FLW. On a global scale, it is 4.4% or 1.8 billion tons of carbon dioxide (CO2) equivalent. This is more than Japan or Brazil emitted in 2015.3
Photodiodes offer a solution
The authors of this article wondered how photonics technology could address this problem and started with a common fruit: apples. A team was formed with some scientists and engineers from Jena, Germany: it includes sensor experts from ams Sensors Germany (a subsidiary of ams OSRAM Group), a food scientist from Friedrich Schiller University, and the director of the Fraunhofer Institute for Applied Optics and Precision Engineering (Fraunhofer IOF).
FLW is a global and manyfold problem and, since part of the problem is losses in fruit production, the scientists turned to a local apple farm to find out more about apple production. The goal was to find a sensing solution to detect the perfect moment for harvest. A time span of one week can be decisive for proper harvesting moment.
The sensing experts’ scientific approach is to measure the spectroscopic properties of the fruits first and in detail. Then, they needed to find a scalable sensor solution. A first condition for the ripeness measurements of apples was to use a noninvasive method that does not consume the test species—to avoid the need for resource-intense laboratory testing.
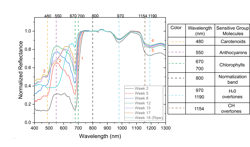
The scientists made single-point reflectance measurements on three sorts of apples, namely Gala, Pirol, and Gravensteiner during the 2023 growing season. The resulting reflectance measurement for Gala apples from the blooming (week 1) until week 18 is shown in Figure 1. They used a spectrometer with a range of 400 to 1300 nm. For comparison of spectra from different times and samples, the 800 nm band was selected as the normalization band in the near-infrared (NIR) due to the consistent value during the season.
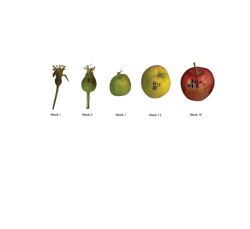
As consumers, we see apples as green, yellow, or red (see Fig. 2). From a scientific point of view, most of these colors are related to the evolution of certain pigments, namely carotenoids, anthocyanins, and chlorophylls, which have a specific reflectance at 480, 550, and 670 nm, respectively. The measured spectra enabled the scientists to capture the evolution of the pigments during the ripening process. Spectral features in the NIR and the shortwave-infrared (SWIR) can be used to identify spectral fingerprints of carbon, hydrogen (C-H), and water (H2O).
The temporal evolution of the spectral evolution is related to the development phases of the plant and its components (see arrows in Fig. 3):
- Increment of the 3 visible (VIS) bands until week 12 can be related to the breakdown of chlorophyll, which has minimum levels at 670 nm in week 18;
- Anthocyanins start to be present since week 15, creating a valley at 550 nm until week 18;
- In parallel to anthocyanins, the carotenoids band starts to be present at 480 nm in week 15;
- H2O and C-H bands from 970 nm until 1190 nm are incrementing in parallel with the starch accumulation up to week 12;
- H2O and C-H bands from 1154 until 1190 nm start to decay at week 15 in parallel to the starch decline.
A major conclusion can be drawn: The reflectivity measurements show the ripening process in detail. This may help predict the right point of harvest and to conduct a harvest well before the end of ripening to support optimum storage, including post-harvest ripening. From a spectral point of view, there are three distinct spectral bands in the VIS, which help determine ripening status. Two more bands in the SWIR support it. Of course, the spectral evolution is different for each type of apple, and the spectral signature for the ripening process must be determined separately for each variety.
A low-cost solution
Currently, the spectral data of different apple varieties is still under assessment. But based on the spectral signatures, a customized sensor can be configured.
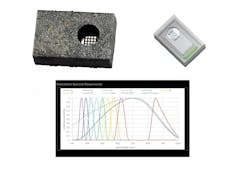
The sensor division of ams OSRAM Group has already developed such systems for color measurements. Sensor units from their AS7341 color sensor family provide color sensing with 11 different photodiodes that measure light through spectral filters (interference coatings).
The unit’s sensors are designed for 350 to 700 nm and one channel in the IR region, while two light-emitting diodes (LEDs) on the module provide illumination. Its main LED is a broadband cool-white LED (6.500 K), which covers the illumination spectrum from 380 to 780 nm. NIR sensing can also be added (see Fig. 4). Six integrating analog-to-digital converters (ADCs) integrate light energy from photodiodes simultaneously. The light measurement module weighs merely a few grams and operates at temperatures between -40° and 85°C.
Future prospects
Measurements of spectral characteristics of three apple varieties during the 2023 growing season shows that ripening phases can be identified via spectral measurements—the determination is based on spectral bands from three pigments, and a sensor solution based on established photodiode technology is proposed. Taking it to large-scale production would require only minor changes in the color filters.
Such a solution must be customized to the fruit variety, but the solution could be extended vertically and horizontally— apple quality could be monitored along the value chain. This would include handling and storage, processing, and marketing. Beyond that, other fruits could be tested in a similar way. The idea stems from a Ph.D. thesis (of the first author), but connects two essential building blocks for a sustainable solution: Scientific spectroscopic measurements and industrial sensing technology. The concept was presented and discussed at the “Green Photonics” workshop at Fraunhofer IOF, which was held May 27-29, 2024.
The sensing concept has even more prospects in the future. While the sensor platform is now built into an inch-sized module, further miniaturization and integration is possible. Like LIDAR modules, which are now available in recent tablets and smartphones, the sensor can be integrated into consumer electronics. This would extend its usage beyond the professional supply chain and put such spectroscopic technology to the hands of end customers.
REFERENCES
1. A. Gatto and M. Chepeliev, Nat. Food, 5, 136–147 (2024); https://doi.org/10.1038/s43016-023-00915-6.
2. See www.epa.gov/facts-and-figures-about-materials-waste-and-recycling/food-material-specific-data.
Abdel K. Ruvalcaba Perez
Abdel Karim Ruvalcaba Perez is an R&D optical system engineer at ams OSRAM Group and a Ph.D. student in physics at Friedrich Schiller University (Jena, Germany).
Gunter Siess
Gunter Siess is principal expert engineer, R&D key expert systems & modules at ams OSRAM Group (Jena, Germany).
Volker Böhm
Volker Böhm is a professor in food chemistry at Friedrich Schiller University (Jena, Germany).
Andreas Tünnermann
Andreas Tünnermann is director of the Fraunhofer Institute for Applied Optics and Precision Engineering (Fraunhofer IOF), as well as a professor in physics and director of the Institute of Applied Physics at Friedrich Schiller University (both in Jena, Germany).


