A single instrument measures numerous network parameters
KEVIN R. LEFEBVRE, P. J. MCGEE, and STEVE COLANGELO
In today's environment, network providers are optimizing their networks to increase the quality of service, while also attempting to reduce costs. Unfortunately these goals can sometimes be contradictory. Optimization requires information about the quality of the network, which is determined using test-and-measurement equipment to analyze the characteristics of the optical fiber and system components. Such testing can be costly in terms of labor and equipment. Equipment capable of performing several types of measurements and analyzing various different characteristics of the network can reduce these test-related costs.
The optical time-domain reflectometer (OTDR) has evolved into an instrument that can help optimize a network for high-quality service while also reducing the labor and equipment costs. It is capable of measuring total link loss, optical return loss, splice loss, and fault identification, as well as qualifying a fiber for Raman amplification and measuring chromatic dispersion (see "Glossary of OTDR terms"). Furthermore, the OTDR can monitor an installed network for faults, reducing the mean time to repair, which then increases the network's quality of service.
OTDR basics
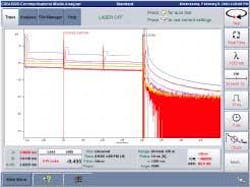
An OTDR is an electro-optical measurement instrument that can characterize an optical fiber. It is used to measure end-to-end loss, macrobend loss, splice loss, reflectance or optical return loss, and to locate a fiber break or defect. The OTDR characterizes a fiber by transmitting an optical pulse from an internal laser down the fiber; the width of the pulse can be controlled. As the pulse travels down the fiber, some of the light within the pulse is scattered in all directions. The light that is scattered in the backward direction travels back to the OTDR in which an optical splitter directs the backward-scattered light to a detector within the OTDR. The detector converts the light into an electrical signal that is analyzed, with the resulting data displayed as a trace on the screen of the OTDR (see Fig. 1).
Within an optical network the optical fiber is mated with other materials at several locations, creating an interface between the fiber and the other material (such as a splice or connector). The interface between the two materials creates a sudden change in the index of refraction, which causes light to scatter backward away from the interface. The scattering of the light from an interface is called a Fresnel reflection. The amount of light scattered by the interface can be analyzed by the OTDR when the optical pulse from the OTDR interacts with the interface. In addition to Fresnel reflections, light also can be scattered by interacting with the microscopic particles within the fiber. This Rayleigh scattering causes the light to scatter in every direction.
As noted, the optical signal measured by the OTDR is the light scattered backward from both Rayleigh scattering and Fresnel reflection as an optical pulse from the OTDR is transmitted down the optical fiber. The backscattered light is related to the level of transmitted light by the backscatter coefficient, which measures the amount of light scattered in the backward direction and is inversely proportional to the optical-pulse width.
When measuring the loss within an optical network with an OTDR, several anomalies such as gainers and macrobend loss require special attention. Bidirectional measurements should be conducted at wavelengths that are susceptible to macrobend loss, such as 1625 nm. In addition, a bidirectional OTDR test will improve the accuracy of the measurement, taking into account the possibility of fiber mismatch when the splice was performed.
Chromatic dispersion
Advances in test-and-measurement technology have allowed the OTDR to be used for more than just return loss, return-loss measurements, and fault location. For instance, chromatic dispersion, a bandwidth-limiting effect, can be measured with an OTDR using the time-of-flight technique. Chromatic dispersion is an inherent nonlinear effect in optical fibers—different wavelengths within an optical pulse travel at different speeds down the fiber. The different speeds of each wavelength cause the optical pulse to spread in time and results in overlapping of adjacent pulses. The overlapping between pulses is defined as intersymbol interference and can cause bit errors within the transmission system, resulting in a bandwidth reduction and consequent reduction of the quality of service. Chromatic dispersion can be compensated for, but accurate compensation requires accurate measurement of chromatic dispersion.
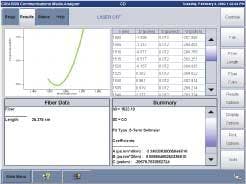
Measuring chromatic dispersion by the time-of-flight method requires determining the amount of time an optical pulse takes to travel down the fiber. Since an OTDR generates optical pulses at different wavelengths and measures the length of the optical fiber, the OTDR can determine the amount of time each optical pulse takes to traverse the length of the fiber. By measuring the traversal time of the optical pulses at different wavelengths, a time vs. wavelength plot can be generated and fit to a curve (see Fig. 2).The OTDR method for measuring chromatic dispersion can provide an accurate measurement if the number of test wavelengths is sufficient to utilize multiple fitting routines (three-term Sellmeier, five-term Sellmeier, or quadratic fitting routines), implying that to perform a five-term Sellmeier fit, at least five test wavelengths will be required. In addition, the OTDR should have very fine resolution so the length of the optical fiber can be accurately determined. Otherwise, additional errors will be introduced into the dispersion calculation, reducing the utility of the OTDR method for measuring chromatic dispersion to short fiber lengths and to low-data-rate optical networks. However, by combining a larger number of wavelengths with a fine resolution and a large number of data points, the OTDR can measure chromatic dispersion in both long-haul and metro applications.
Raman amplification
Raman amplifiers can amplify signals over the entire length of an optical fiber. Installing a Raman amplifier in an existing system requires qualification of the optical fiber to determine whether the loss of the system can support the appropriate gain and noise figure associated with Raman amplification. This requires the determination of the loss profile of the optical fiber to identify how the pump energy will be distributed through the length of the fiber, how the pump and signal energies will interact, and how much splice and connector losses interact with the pump signal. Hence, by testing the optical fiber with an OTDR at both the transmission wavelengths and the pump wavelengths to determine the loss profile, predictions of the gain and noise figure of a Raman amplifier can be obtained. Note that each optical fiber will have a different loss profile, resulting in a different resultant gain and noise figure when the Raman amplifier is installed.
Monitoring optical fibers of an installed system and locating faults cost-effectively will decrease the mean time to repair. An OTDR can locate a fault by monitoring either the dark fibers or the active fibers. While monitoring dark fiber is the most cost-effective method, active-fiber monitoring may be necessary when dark fibers are not available, or when monitoring of a specific optical fiber within the cable is desired. In this scenario, out-of-band wavelengths are used to monitor the active optical fiber. Typically, 1625 nm is used to monitor the transmission system; however, 1310 nm is used to avoid any Raman effects that would occur between C-band wavelengths and 1625 nm.
Kevin R. Lefebvre, is the advanced systems product manager at NetTest USA and an instructor in the telecommunications department at the State University of New York, Institute of Technology; P. J. McGee is the optical network services and OEM product manager; and Steve Colangelo is the OTDR product manager at NetTest USA Instrumentations Division, Center Green Building 4, 6 Rhoads Rd., Utica, NY 13502; e-mail: [email protected].

