Fluorescence-emission spectroscopy of a photoexcited sample is a powerful tool for the study of biologically important compounds and reaction kinetics. While similar to conventional spectroscopic analysis in many ways, fluorescence spectroscopy is also concerned with the time evolution of the sample emission. Because the fluorescence lifetime of an organic molecule is dependent on the microenvironment in which it is placed, "fluorescence measurements in the time domain possess much greater information content about the rates and kinetics of intra- and intermolecular processes than is afforded by wavelength spectroscopy alone. A simple analogy . . . is that of motion pictures in comparison to still photographs."1 During the past 25 years, the availability of tunable, picosecond laser sources has resulted in the use of time-dependent techniques to study the structure of proteins, membranes, and nucleic acids in addition to the kinetics of important biochemical reactions.
Similar in many respects to an excitation spectrometer (see Laser Focus World, June 1997, p. 81), a time-resolved fluorescence spectrometer uses light from a laser, spectrally filtered lamp, or synchrotron source to excite the sample. Fluorescent light emitted from the sample cell is collected and imaged into a monochromator or filter tuned near the peak of the emission band. A phototube or other detector converts the spectrally filtered output for subsequent analysis. Information on the kinetics of the decay process is obtained by using a pump source that is modulated on a time scale comparable to the decay times of interest in combination with specialized detection techniques.
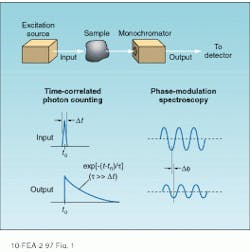
Figure 1 shows the basic principles underlying the two types of time-resolved detection. In the upper diagram, the sample is excited by a pulse that is short compared to the fluorescence decay time and the time evolution of the fluorescence emission measured directly. Time-correlated single photon-counting techniques are commonly used to record the emission profile for subsequent computer analysis.
An alternative technique is based on the measurement of the phase delay and amplitude modulation index of the fluorescence emission with respect to a periodically modulated excitation source. Known as phase-modulation spectroscopy, this technique combines heterodyne detection with standard lock-in techniques to obtain raw data. This article describes the basic principles of these techniques and their common hardware implementations.
Photon counting measures decay times directly
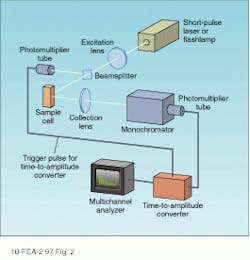
In a time-correlated photon-counting setup, pulse decay times are measured directly by recording the time evolution of the spectrally filtered sample emission (see Fig. 2). An excitation pulse is provided by imaging the output of a short-pulse laser or spectrally filtered flashlamp into the sample cell. The fluorescence emission from the cell is collected using a conventional optical system and the wavelength of interest selected by using a monochromator or spike filter. Light emerging from the spectral selector is imaged onto the input aperture of a fast detector with a time constant capable of resolving the fluorescence decay of interest.To understand the operation of this system, we first consider the case of a single species with fluorescence decay time t. Assuming the excitation pulse to be short-lived with respect to this time, the fluorescence emission from the sample consists of a short, intense flash followed by a slower decay that is described by
I(t) = (1/t) exp(-t/t) [1]
In the time-correlated single photon-counting technique—the most widely used—the detector (typically a conventional or multichannel-plate [MCP] photomultiplier tube) operates in a pulsed mode with each pulse ideally corresponding to the arrival of a single photon at the photocathode surface. By counting the number of pulses produced by the phototube within a series of discrete, sequential time intervals after the excitation pulse, a histogram approximating the curve of Eq. 1 is obtained. The decay time is determined from these data through the use of a computer-based algorithm.
The histogram of single photon events is recorded by using a time-to-amplitude converter (TAC) in combination with a multichannel analyzer (MCA). The TAC produces an output pulse with an amplitude that is proportional to the time delay between a trigger (typically the excitation pulse) and the detection of a photon by the photomultiplier tube. The MCA counts the number of pulses with a particular amplitude and stores them in separate memory channels. Each channel, therefore, corresponds to a different fluorescence decay time, and a map of the MCA memory yields the required time histogram of the pulsed emission statistics.
The range of time constants that can be determined using the single photon-counting technique is dependent on the length of the excitation pulse, the time resolution of the TAC/MCA combination, and the time constants associated with the photomultiplier tube and spectral filter. In general, using picosecond pulses from a modelocked dye laser for excitation and a MCP photomultiplier for detection, it is possible to measure fluorescence decay times of a few hundred picoseconds.
Because the MCA memory is actually a statistical record of the photon-emission process, care must be exercised to eliminate errors due to multiple-event pileup and other common statistical effects. A more difficult problem, however, is the analysis of fluorescence decay curves having multiple components. In general, the fluorescence emission from a complex sample is described by the summation of contributions from several molecules, each having a different decay rate. Mathematically, this situation is described by the more general version of Eq. 1
I(t) = Si(1/ti) ai exp(-t/ti) [2]
In those cases in which two components have lifetimes that differ by a few tens of percent, it is difficult to determine whether the resultant overall decay is the result of emission from one or more species. Assuming equal emission intensities from the two components of a mixture, single photon-counting techniques can resolve the two species if one has an emission lifetime that is less than two-thirds of the other. In cases in which the emission intensities are not the same, a greater lifetime differential is required.
Frequency-domain analysis
Phase-modulation spectroscopy is a frequency-domain alternative to the time-correlated single photon-counting technique.2 Although the two techniques are functionally equivalent in many respects, phase-modulation spectroscopy uses different hardware and is somewhat more effective in analyzing the emission of a multicomponent sample.
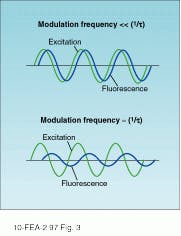
In contrast to pulsed techniques that record the decay in fluorescence-emission amplitude directly, phase-modulation spectroscopy looks at the phase and amplitude of the fluorescence emission relative to a periodically modulated pump beam. Assuming a sinusoidally modulated excitation source, the amplitude and phase of the fluorescence emission are a function of both the input frequency and the fluorescence lifetime. In general, the emission tracks the excitation for frequencies that are small relative to the inverse fluorescence decay time. As the frequency is increased, a significant phase delay and decrease in modulation amplitude is observed.
Assuming a sinusoidal variation of both excitation and fluorescence emission, it is useful to define a modulation index that is equal to the peak-to-peak amplitude of the ac component divided by the average dc level. The relative modulation index m(w) is equal to the ratio of the modulation index for the output divided by that of the input. For a single exponential decay time t, the phase angle f(w) and relative modulation index m(w) are related to the input frequency w by
tan f(w) = wt
m(w) = (1 + w2t2)-1/2 [3]
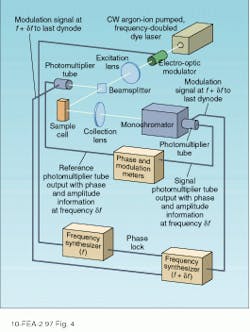
By measuring the relative modulation index and phase over a range of frequencies, it is possible to determine the fluorescence lifetime. Different excitation frequencies causes the fluorescence emission to vary (see Fig. 3). In practice, an electro-optic modulator is used to vary the input frequency over a wide range, while a phase-sensitive detection scheme is used to determine the relative phase.Heterodyne detection also makes it possible to use any phase-locked excitation source power at the desired modulation frequency. As a result, modelocked lasers have been used in combination with MCP photomultiplier tubes to increase the bandwidth of the phase-modulation technique to frequencies as high as 10 GHz.
Although the detection hardware required for phase modulation and time-correlated photon counting are somewhat different, the two techniques are functionally equivalent in many respects. For single-component decays with time constants in the 1–100-ns range, the two techniques yield similar accuracies. Differences are observed, however, for long decay times in which photon-counting techniques provide more reliable data. In the case of multicomponent decays, phase-modulation techniques are somewhat more reliable and can discriminate lifetime differences that are too small to be resolved by the alternative technique.
A wide range of excitation sources that can be used for fluorescence-lifetime measurements. Nanosecond pulsed flashlamps, used in conjunction with a filter monochromator, are a reliable and relatively inexpensive source of excitation for time-correlated photon counting. Commercial units, designed to operate with several different fill gases, are available from Oriel (Stratford, CT) and can be used to accurately measure lifetimes between 100 ns and 100 µs.
For faster measurements, modelocked and cavity-dumped dye lasers, frequency-doubled to UV wavelengths, were the standard for many years. Excited by an argon-ion or frequency-doubled Nd:YAG laser, the commercial availability of these sources significantly accelerated progress in fluorescence lifetime spectroscopy. Used in conjunction with MCP photomultiplier tubes, these sources were ideal for investigating biomolecules with lifetimes in the 1–100-ps range. As mentioned, the development of cross-correlation techniques made these sources useful for phase-modulation spectroscopy as well as time-correlated photon counting.
As with other ultrafast applications, modelocked Ti:sapphire lasers have recently become the preferred source for lifetime measurements due to their broad tunability and solid-state construction. In addition to improved ease of use, these sources offer reduced pulsewidths in comparison to commercial dye lasers. The UV wavelengths required for many fluorescence studies is typically obtained by frequency-tripling the output of the Ti:sapphire laser. Although a few fluorescence laboratories have made the transition, the use of a frequency-doubled, diode-pumped Nd:YVO4, Nd:YAG, or Nd:YLF laser pump source will lead to further improvements in pulse stability and operator convenience. o
ACKNOWLEDGMENT
The author wishes to thank Dr. Henryk Malak of the Center for Fluorescence Studies at the University of Maryland School of Medicine (Baltimore, MD) for his informed technical input.
REFERENCES
1. D. J. S. Birch and R. E. Imhof, Topics in Fluorescence Spectroscopy, Vol. I, J. R. Lakowicz, ed., Plenum, New York, NY, p. 1 (1991).
2. J. R . Lakowicz, Principles of Fluorescence Spectroscopy, Plenum, New York, NY (1983).


