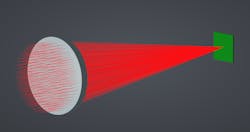
How can you tell if you really need an aspheric lens?
Several factors should be considered when selecting lenses best suited for particular laser applications. Once a lens material and coating are selected, a laser engineer decides whether the application needs a simple plano-convex, best form (see Note 1), or aspheric lens shape.
Answering this question properly requires knowledge of the system’s laser beam parameters (wavelength, diameter, mode, or beam parameter product [BPP]); the lens parameters (diameter, thickness, surface radii); and the application’s requirements (focus diameter, power level, power density requirements, etc.). Once the laser and lens parameters are known, focused beam metrics can be calculated and used to determine if they will meet the application’s requirements.
High-speed diamond turning machines, magnetorheological finishing (MRF) machines, and CNC asphere polishing machines, along with increased competition in the industry, are making aspheric lenses more cost-effective and commonplace. But costs are still relatively high compared to simple plano-convex and best form lenses, so it’s crucial for laser engineers to choose the appropriate lens shape for the application.
Main laser beam types
To determine whether a lens is suitable for a specific laser application, it’s important to know the laser beam type and its parameters. Laser wavelength, power, and beam profile are the three key factors needed for proper analysis of a lens. Laser power and wavelength are easy parameters to identify for most laser systems, but the beam profile can be confusing to properly parameterize.
Theoretically, Gaussian profiles have an infinite diameter. It’s not realistic to use in a lens design or analysis program, so many engineers use a beam size of 1.5X the e-2 power point diameter. Some even use the Gaussian beam diameter at the e-2 power points, clipping ~13.5% of the beam’s energy. These diameters are often used to set the clear aperture of the lens system, too. To ensure best performance when designing aspheric lenses, a beam diameter of 1.7X the e-2 power point diameter should be used. During the design phase, most analysis types trace rays through the lens and analyze the rays at the image plane, so it is important that the rays cover the full beam diameter. There are exceptions to this rule, but for most cases, 1.5–1.7X the e-2 power points will provide adequate results.
Fiber tip diameter and fiber numerical aperture are very important when designing and analyzing lenses for multimode fiber laser beams. If a manufacturer claims a full beam diameter of X mm after collimation, then X is the value that should be used to analyze a focusing lens. This specification should also be verified for the same reasons when designing collimator lenses.
If you don’t know the laser beam parameters, then at a minimum, a beam size that fits the full aperture of the lens should be used. For example, if using a 30 mm lens with a usable clear aperture of 26 mm, a beam size of 26 mm should be used to analyze lens performance.
Lens and beam analysis types
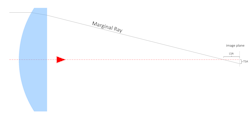
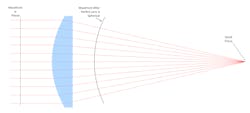
Spherical aberration is traditionally one of the main methods used to analyze single lenses in monochromatic systems (lasers, in this case). There are two types of spherical aberrations: longitudinal (LSA) and transverse (TSA)—these terms are used to differentiate between a ray error that’s transverse to the central axis and measured at the image plane, and a ray that intersects the central axis at some point before or after the image plane. Figure 1 illustrates these two measurements. Typically, only one of these parameters is used to evaluate a lens. Calculating this parameter is simple with Snell’s Law for refracting a ray through the lens, as well as simple trigonometry to trace the ray to the image plane.
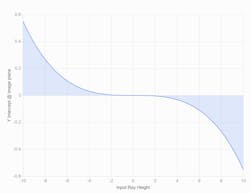
It’s possible to map a small set of rays through the center of the lens. A typical TSA plot is produced by plotting the input ray height at the lens (x-axis) against the axial ray height at the image plane (y-axis).
As demonstrated in Figure 2, the edge ray intercept (+10 mm from the center of our lens) strikes the image plane at -0.6 mm. The minus sign indicates that the ray strikes the image plane below the central axis, and rays starting at ±3 mm strike the image plane close to zero. But for input heights greater than this, the deviation at the image plane increases exponentially.A perfect lens produces a horizontal line at zero on the y-axis. Small amounts of deviation are okay, but ±0.6 mm indicates significant amounts of spherical aberration. For the application, this means increased spot size and generally poor performance. As a very rough approximation, the maximum spherical aberration should be less than about one wavelength.
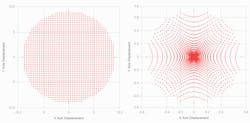
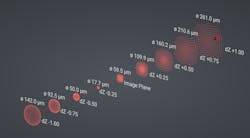
Through-focus spot diagram. A full spot diagram is formed by tracing rays through the full aperture of the lens and then plotting the (x, y) rays’ position at the image plane. Figure 3 shows a sample spot diagram plot: (a) depicts the ray positions at the entrance to the lens, while (b) shows the distribution of these rays at the focus.We can use the same approximation for this plot as the transverse spherical aberration plot. A spot diagram for a lens in which all rays fall within a diameter of one wavelength is ideal when designing a precision lens. A precision lens will focus the spot to the smallest possible diameter.
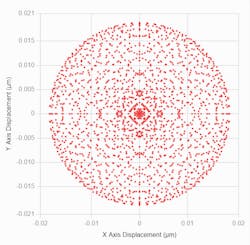
Figure 4 is a spot diagram plot for an aspheric version of this lens (see Fig. 3b). Note that the x and y axis scale is in microns. In this lens, spherical aberrations have been minimized (<1/10 of a wavelength).Wavefront error plots are typically in waves (sometimes just λ) at the design wavelength. A wavefront error of several waves is very bad for almost all optical applications. A good approximation for precision lenses is probably <1/10 λ, although <1/20 λ is better if we are striving for the best possible design.
In the optics field, it’s common that a maximum wavefront error for a reasonably good lens system is <1/4 λ (or <1/4 wave). Although this rule was developed for astronomical telescopes based on the Rayleigh criterion (see Note 2), it was adopted by the laser industry as well for precision optics in laser applications, but isn’t sufficient to get the smallest possible focused spot.
Spherical vs. aspherical focusing lens
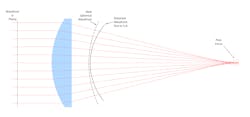
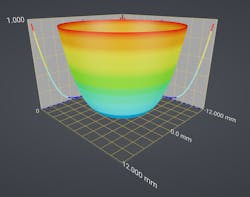
How are these analyses useful to determine whether a focusing lens is good enough for the job? Often, applications will dictate system requirements such as a final spot size. But theoretical spot size is determined by system parameters like laser beam characteristics and focal length of the optic(s). Wavefront error analysis is a particularly useful tool to explore whether the focusing lens is introducing aberration into the system and how this might affect overall performance (see Fig. 9).Let’s consider a 25.4-mm-diameter, 100-mm EFL fused-silica (FS) lens used with a 1.07-µm wavelength laser. A quick design made in an online lens design program, LensKit (www.lenskit.app), yields a biconvex lens as the best form spherical lens. Nominally, this design has 1.26 waves of wavefront error. For comparison, let’s also consider this same lens aspherized to remove all spherical aberration. This aspherized version has a wavefront error of <1/1000 waves.
Figure 10 analyzes the wavefront error for a spherical biconvex FS 100 mm FL lens (left) and an aspheric biconvex FS 100 mm FL lens (right).For cladding or welding applications, the degradation of the focus from using the spherical biconvex focusing lens may be acceptable. For high-precision cutting or drilling applications, the degraded performance of the spherical lens is probably less acceptable, in which case purchasing an aspheric lens is justified.
There are many tradeoffs system designers need to make. By using the analysis techniques above, you are better equipped to decide if an aspheric lens is money better spent elsewhere, a nice upgrade in performance, or a requirement for the system to function. Metrics such as wavefront error analysis or spot diagrams can guide logical decisions when choosing a lens for a laser application.
The analyses discussed can be done analytically by an intrepid engineer or by using a free online lens analysis tool.
NOTES
1. “Best form” lens: a spherical lens where the radii of the lens are optimized for best performance. For monochromatic laser lenses this involves optimizing the lens for minimum spherical aberrations. These lenses could then be either meniscus, biconvex, or biconcave. There could be very rare instances where the best form lens could be plano-spherical in shape.
2. The concept of the Rayleigh criterion for resolution was first introduced by Lord Rayleigh (John William Strutt) in his 1879 paper, “On our perception of small angles,” published in Philosophical Magazine. He used the criterion to explain the limits of resolution of the human eye. The paper was later published as “On the Theory of Vision” in Royal Society Philosophical Transactions. In this paper, Rayleigh described the criterion as the condition under which two close point sources of light will be seen as separate by the observer. He also showed that the criterion can be used to determine the minimum angular resolution of an optical instrument.
REFERENCE
1. W. J. Smith, Modern Optical Engineering, 3rd Edition, McGraw-Hill (2000).
About the Author
Gary Herrit
Co-founder, LensKit
Gary L. Herrit, who previously held roles in optical design, laser test design, and customer support at II-VI Infrared (now Coherent), is a semi-retired optical design consultant and co-founder of LensKit.
Rebecca Durfee
Optical Design Consultant, Thresher Engineering and Optics
Rebecca Durfee, formerly of II-VI Infrared (now Coherent), is an optical design consultant for Thresher Engineering and Optics (Mars, PA).
Justin Kovalchuk
CTO, GenomeMiner.ai, and co-founder, LensKit
Justin Kovalchuk, a former optical systems designer for laser applications at II-VI Incorporated (now Coherent), is CTO at GenomeMiner.ai and co-founder of LensKit.
