ANDREW D. YABLON
Accurate and complete knowledge of an optical fiber’s refractive-index profile (RIP) is critically important for predicting and understanding diverse optical-performance characteristics including chromatic dispersion in singlemode fibers, modal dispersion in multimode fibers, macro- and microbend behavior, interconnection losses, and nonlinear optical interactions. Not surprisingly, the first methods for measuring a fiber’s RIP were developed in the 1970s, not long after the advent of the fibers themselves.
Previously, the refracted near-field (RNF) method was the dominant commercial approach. Recently, several new and powerful measurement techniques have been developed, and some have already been commercialized. These new technologies include quantitative phase microscopy (QPM), differential interference-contrast microscopy (DIC), computerized tomography (CT), and multiwavelength interferometry (MWI). They are inspired by biomedical imaging and enabled by faster computer processors as well as by more sensitive high-resolution array detectors.
Most optical fibers are drawn from a preform, and typically this preform’s RIP is itself measured at some stage during the manufacturing process. While preform RIPs can be measured relatively accurately, direct measurement of the fiber’s RIP is preferable for a few reasons: Fiber-draw effects are only present in the fiber; some preforms are assembled on the draw tower and therefore cannot be measured prior to draw; and consumers of optical fiber typically do not have access to the manufacturer’s preform RIP data. Measurement of a fiber’s RIP is inherently more challenging than measuring a preform because of the microscopic sample dimensions.
Refracted near-field (RNF)
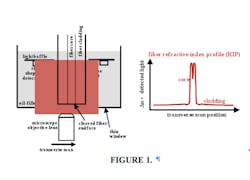
In RNF, a focused laser spot is scanned across the endface of a cleaved fiber sample and the refractive index is determined from the amplitude of light escaping from this sample (see Fig. 1).1 This is fundamentally an amplitude measurement, as the refractive index scales with the single-pixel detector response; as a result, the accuracy of RNF instruments can suffer from calibration drift. They must be periodically recalibrated against an industry-standard fiber, which is itself measured interferometrically. Furthermore, it is difficult to create a cleaved end without defects or dirt contamination that corrupt RNF measurement. Needless to say, axial variations in the refractive index, such as those found in a grating or fusion splice, cannot be mapped using RNF.
Unlike RNF, the new techniques are phase measurements, meaning that the relative brightness of different pixels in an array detector encodes the phase, and hence RIP, information. Furthermore, the new technologies all share the fact that they measure the fiber sample’s RIP transversely (that is, through the side) rather than at a cleaved endface. This is quite literally a new direction for optical-fiber RIP measurement, and permits axially varying RIPs to be measured, such as those found in fiber gratings, fusion splices, physical tapers, capillary fibers, directional couplers, and fiber taps.
Differential interference contrast (DIC)
This form of microscopy is a longstanding approach for providing image contrast from the phase variation in transparent biomedical specimens. Differential-interference-contrast microscopy was first applied to optical fibers by independent research groups at the University of Melbourne (Melbourne, Australia) and Tsinghua University (Beijing, China). Phase contrast is produced from the variation in path length experienced by two interrogating beams that are laterally displaced by a distance of a few hundred nanometers.2 While this is a transverse technique, it is strictly single-wavelength. Because the interference is achieved via polarization, there is some concern regarding the influence of fiber birefringence associated with residual stresses and strains in the fiber, particularly in polarization-maintaining fibers. As with most transverse phase-imaging techniques, any refraction of the ray by the sample is assumed to be negligible and ignored.
Quantitative phase microscopy (QPM)
This approach was developed at the University of Melbourne for both optical-fiber and biomedical applications. In QPM, the spatial distribution of phase in a fiber sample is determined from magnified images of the fiber acquired at slightly different focal planes. Like other transverse techniques, QPM has been used to map the refractive index of axially heterogeneous structures such as fusion splices, but like other transverse techniques it also requires tomography when applied to non-axisymmetric fiber samples. Like DIC, QPM is a single-wavelength measurement and has been used to resolve the submicron undulations in a fiber Bragg grating and to measure microspheres trapped inside the void space of a capillary fiber.3
Multiwavelength interferometry (MWI)
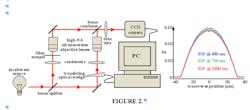
Unlike all other measurement techniques that measure a fiber’s RIP at a single wavelength, MWI permits the direct and simultaneous measurement of a fiber’s RIP at a multiplicity of wavelengths, thereby revealing any spectral dependence. During MWI the fiber sample is placed in one arm of a Mach-Zehnder interferometer illuminated by a broadband source that is both temporally and spatially incoherent (see Fig. 2).4 A computer-controlled phase shifter imposes a known continuous phase shift and the detected image of the fiber sample is processed via Fourier analysis to reveal the fiber’s index profile across the entire band of illumination.This approach is essentially the application of Fourier-transform spectroscopy to each pixel in the fiber-sample image. The variation of phase across the image of the fiber at a particular Fourier frequency reveals the optical path length at that optical wavelength. Unlike other techniques, MWI can often provide the RIP at, or very near to, the operating band of the fiber, thereby eliminating the need for RIP extrapolations based on Sellemeier coefficients. MWI can also directly reveal the material dispersion of the fiber in a spatially resolved manner, which is an important advance since material dispersion could only be estimated from precise knowledge of the fiber doping profile. Another advantage of this technique is the incorporation of high-numerical-aperture oil-immersion objectives providing diffraction-limited spatial resolution.
Computerized tomography (CT)
Because RNF has access to a cleaved end, it can laboriously map out the fiber’s RIP across the entire fiber’s cross-section by raster scanning. Recently developed transverse methods like DIC, QPM, and MWI do not have this luxury since the interrogating light must necessarily traverse through the entire fiber and cannot be localized to a particular point. Computerized tomography, which was originally developed for medical x-ray imaging a few decades ago, was recently applied to transverse optical-fiber measurements, thereby enabling RIP variations to be mapped across a fiber’s entire cross-section. In CT, measurements of a fiber sample are acquired at a multiplicity of angles and these measurements are synthesized together to reveal the complete two-dimensional RIP.5 Computerized tomography can also be repeated at many axial positions along a fiber sample to measure the three-dimensional variation of refractive index, for example, at a grating, coupler, fusion splice, or physical taper.
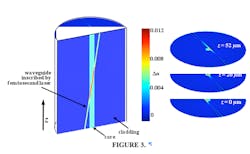
Tomography can reveal unexpected azimuthal refractive-index nonuniformities in fibers that are mistakenly assumed to be perfectly axisymmetric, such as graded-index multimode fibers (GIFs or GI-MMFs). Computerized tomography is essential when using transverse methods to measure nonaxisymmetric fibers such as PM fibers or cladding-pumped rare-earth-doped fibers with a noncircular cladding. In an example, a sample three-dimensional refractive-index profile measurement is obtained by combining MWI with CT (see Fig. 3), resulting in the variation of RIP along the length of a singlemode fiber inscribed with an index perturbation by a femtosecond laser. Such a fiber can be used as a low-loss inline optical-fiber power tap.Future outlook
Refractive-index-profile measurement technology naturally follows optical-fiber design trends. At this point, most fiber-profiling technologies are effective for measuring traditional telecom fibers. However, certain types of microstructured optical fibers are difficult to measure with any current fiber-index-profiling technology, and therefore opportunities for important improvements remain. For example, air holes must usually be infused with refractive-index-matching oil to avoid catastrophic refraction and reflection at their boundaries, and even in this case ray refraction may require a diffraction approximation. Recent growth in the field of large-cladding-diameter high-power fibers has elevated the importance of measuring the RIP of such fibers. Finally, it is worth noting that many of the technologies used for optical-fiber refractive-index profiling are also effective for characterizing planar optical waveguides, and the ongoing development of (nonfiber) photonic-crystal structures may also provide important applications for these technologies.
REFERENCES
1. D. Marcuse, Principles of Optical Fiber Measurement, Chapter 4, New York: Academic Press (1981).
2. B. Kouskousis et al., Appl. Opt., 47, 28, 5182 (October 2009).
3. N.M. Dragomir et al., “Three-Dimensional Quantitative Phase Imaging: Current and Future Perspectives,” Proc. SPIE, 6861 (2008).
4. A.D. Yablon, IEEE J. Lightwave Technol., 28, 4, 360 (February 2010).
5. B.L. Bachim et al., Appl. Opt., 44, 3, 316 (January 2005).
Andrew D. Yablon is a founder and president of Interfiber Analysis, 26 Ridgewood Dr., Livingston, NJ 07039; e-mail: andrew_yablon@interfiberanalysis.com; www.interfiberanalysis.com.

