Advances in Optical Manufacturing: Measurement considerations when specifying optical coatings
Accurately measuring the performance of an optical thin-film coating can be as challenging as designing and manufacturing it. Understanding measurement techniques and uncertainty when specifying and procuring optical coatings is important for optical system designers. This article is meant as a brief introduction to optical coating measurement for optical system designers, quality engineers, and purchasing agents. In the course of the article, we hope to touch on several of the more common measurement questions that are asked of coating engineers when optical systems are being specified.
Understanding how performance is measured
The following is an example of a simple measurement oversight with a potentially large effect on system performance. This example is meant to highlight the need to ask questions about how things are measured when purchasing a coated optic.
In this example, a system designer is interested in including an optical filter in the system that reflects a minimum of 99% intensity in the 350–450 nm wavelength band and transmits greater than 99% at longer wavelengths. The coating engineer has measured loss in single layers of the constituent coating materials in the past and has determined, within the measurement uncertainty of their spectrophotometer, that there is little scatter or absorption in any given layer of the filter.
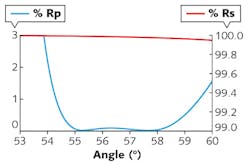
Once the coatings are deposited, if the performance is tested and reported only in transmission, the broadband mirror and passband regions of the filter will both appear to be within the designer’s specified tolerance. With broadband dielectric mirrors, however, it is possible to have very different performance when measured in transmission vs. reflection. Broadband dielectric mirrors create resonant structures within the multilayer stack, leading to field amplification at certain wavelengths. Even a very small amount of loss in individual coating layers results in large losses for the filter at these resonant frequencies. When measured in transmission, this resonant loss has a positive influence on blocking, making the mirror appear better than it actually is (see Fig. 1a). When measured in reflection, this same resonance creates an obvious and significant ripple in reflectivity across the visible spectrum, and consequently the coating doesn’t meet the specification for the mirror (see Fig. 1b).
Measuring specular performance
Spectrophotometers are the primary measurement tool in most optical coating laboratories. They are more versatile and less expensive than laser-based measurement systems and, when used properly, can be very effective. Most coating companies use commercially available spectrophotometers; standard features include grating-based monochromators and a reference beam to deal with light source and detector drift.
It is important to note that the following discussion is of general considerations for commercially available instruments. In some cases, optical coating companies will develop their own spectrophotometers that have measurement advantages over more general instruments for their particular application.
A large range of accessories are available for commercial instruments. Each of these accessories has advantages and disadvantages for different measurement types. A full review of these accessories and their strengths and weaknesses is beyond the scope of this article; we will instead focus on trying to provide an understanding of some general considerations when measuring with spectrophotometers.
To make a measurement with a spectrophotometer, known reference measurements with intensities less than and greater than that for the surface under test are made across the wavelength band of interest. A detector-specific equation is then used to correlate measured signals at each wavelength to sample intensity within this range. Uncertainty associated with this calculation is often referred to as error from detector nonlinearity.1 In the simplest case, reference measurements are taken with a blocked beam (0% intensity) and open beam (100% intensity).
Photometric, or ordinate, uncertainty is partially a function of the range used for the reference measurements. For example, when measuring surfaces with antireflection (AR) coatings in reflection, it is common practice to reduce uncertainty in detector nonlinearity by using a single-surface reflection of glass with tightly controlled index of refraction as the high-signal reference instead of an open beam. Schott N-BK7 glass is commonly used because of its stability in refractive index.
Uncertainty in wavelength for commercial systems is typically less than ±0.3% for ultraviolet (UV) through near-infrared (NIR) wavelengths. It is relatively straightforward to check wavelength calibration using lamp emission lines and/or traceable glass standards doped to give sharp absorption peaks in the wavelength range of interest.
Spectrophotometer-based transmission measurements
One of the fundamental challenges of optical coating measurement is that it is difficult to measure AR coatings and mirror coatings accurately and precisely in transmission and reflection, respectively. The following points highlight two of the larger sources of error when measuring AR surfaces in transmission using spectrophotometers:
1. For AR surfaces measured in reflection, a small error in photometric accuracy equates to a typically insignificant measurement error of coating performance. For example, a 1% error in measured reflected intensity (R) for a surface that only reflects 0.1% of incident light equates to an inaccuracy in measurement of 0.001%R for the surface under test. The same error in transmission (T) would be much more significant; 99.9% transmission × 1% error equates to an inaccuracy in transmission of nearly 1%T.
2. Detectors are often spatially variable. The effect of a small change in beam position from reference to sample measurement is small when measured in reflection and large in transmission for the reason outlined in point 1. As the position of the beam changes between baseline and sample measurements, the accuracy of the measurement suffers. Beam-path changes become more significant as sample thickness, index of refraction, and measurement angle increase. The degree of beam-position change is described by Snell’s law of refraction, the effect of which can be amplified by multiple Fresnel reflections from opposing optical surfaces. For thick witness samples mounted at high angles, it can become nearly impossible to get a reasonably accurate transmission measurement (a witness sample is typically a small, flat plate of glass that is coated along with the rest of the components, serving as a testable example and record of the particular coating run). Measuring transmission through a lens using a spectrophotometer is challenging for the same reasons.
The challenges outlined above can be addressed by adding an integrating sphere to the detector, using thin witness samples, and decreasing the distance from the sample to the detector. Larger integrating spheres typically achieve better results because of averaging of light over many bounces within the integrating sphere before it strikes the detector. They typically contain baffles to eliminate direct bounces to the detector and a smaller port-window fraction to reduce the proportion of light leaving the sphere.2
Using larger integrating spheres can have drawbacks, however, when measuring with a small beam (required for small samples or high angles), in that less light reaches the detector, leading to potential signal-to-noise issues. With a very good setup on a commercial instrument, a best-case measurement uncertainty for a flat, thin AR-coated witness sample at normal incidence is typically in the range of ±0.1%T.
Polarizers and variable-angle detector modules can be purchased for commercial spectrophotometers. Variable-angle reflectance accessories do an adequate job of measuring AR performance in reflection. A measure of the Brewster’s angle can be used to gauge uncertainty in angle and polarization; with a good setup, these sources of uncertainty are typically small compared to the photometric sources of error. A good summary of sources of uncertainty in transmission measurements can be described using the following formula:3
The combined uncertainty (μtotal) is a function of measurement repeatability (μs), beam alignment (μA), ordinate linearity (μN), polarization uncertainty (μp), angle of incidence uncertainty (μo), and wavelength uncertainty (μw).
A suggested approach to gauging spectral performance of most AR coatings is to perform measurements in reflection over the complete angle range of the specification and a measurement in transmission to verify loss at normal incidence. For critical applications, it is important for system designers to know whether they are receiving measurements over the full angle range or theoretical data at high angles when they purchase a lens.
Spectrophotometer-based reflection measurements
There is always some minimum angle (typically less than 10º) at which a sample can be measured in reflection because of the physical constraints of light source and detector placement. For most optical coatings, the difference in performance from 0 to 10º angle of incidence is insignificant.
An accurate measurement of highly reflective surfaces using a spectrophotometer is challenging for many of the same reasons outlined above for AR transmission measurements. Small changes in measured signal at the detector between the reference and measurement lead to significant errors in measured performance. Inserting a test sample into the measurement path without changing the path used in baseline reference measurements is always tricky when measuring in reflection.
Additionally, there can be challenges associated with reflectance standards. Ideally, a traceable calibrated mirror is used for the reference measurement. Degradation of these reference mirrors over time because of metal oxidation and/or mechanical degradation must be considered. Total uncertainty in measuring high reflectors depends on all the terms outlined in equation 1.1 for transmission. However, for mirror measurement, the term for ordinate uncertainty (μN) is influenced to a greater degree by uncertainty in the reflectivity of the reference. A general measurement stage on a commercially available spectrometer is capable of measuring high reflectors with approximately ±0.5 %R uncertainty, while a carefully aligned and calibrated commercial spectrophotometer with a precision reflectance accessory is capable of measuring to approximately ±0.05 %R uncertainty.
Cone angle
Spectrophotometers generally have some cone angle associated with the test beam. The best spectrophotometers for optical applications are more-collimated, high f-number systems. Understanding the effects of measurement-system cone angle is especially important for coatings such as polarizers and precision filters. The placement of a filter or polarizer edge can be skewed significantly when using poorly collimated test beams. Cropping the aperture of the beam on noncollimated systems helps, the tradeoff being a reduction in signal to noise.
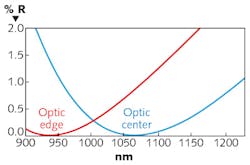
Also, for high-precision filters, the signal bandwidth as dictated by the grating and slit width can become limiting. The best measurements of high-precision filters and polarizers are typically made with custom (collimated) spectrophotometers and/or laser-based measurement systems. Commercially available spectrophotometers typically have a half-cone angle of 2–3º. An example of the effect cone angle can have on coating performance can be seen in Fig. 2.Witness samples
All the considerations mentioned above are important; however, even if everything is done perfectly, the data is of no value if the witness sample is not representative of optic performance. It is necessary to use witness samples because in most cases it is very difficult to get an accurate measurement directly off the optic. For AR coatings, it is crucial that the index of refraction and dispersion of the witness sample closely match (or exactly match) that of the optic.
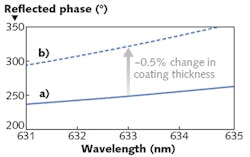
Accurately measuring coating performance often requires that coating houses maintain a large inventory of witness samples covering the full range of substrate optical properties. Placement of the witness sample(s) is also of critical importance. Witness samples should be placed in such a way as to match both the height and angle of the surface inside the coating chamber. For large and/or steeply curved surfaces, a second witness sample at the outside edge of the clear aperture can be required. The uniformity of an optical coating changes inside of a chamber as a function of radial distance, height, and surface angle. Figure 3 shows an example of the effect of uncorrected nonuniformity on coating performance.Laser-based measurement techniques
For the highest-precision measurements of reflectivity, transmission, and loss, laser-based measurement techniques can be required. A dual-beam laser-based reflectometer (LR) is capable of measuring with great accuracy and precision across wide angle ranges in reflection and transmission. When designed well, these instruments have significant advantages in beam stability and test beam geometry and all the advantages of a collimated light source. A well-built LR can have measurement uncertainties of ±0.01 to ±0.05% for mirrors and highly transmitting surfaces as measured on flat witness samples.4-6
Laser-based cavity ring-down measurement systems can be used to measure optical loss (absorption + scatter) or reflectivity with very high sensitivity. These systems measure the change in intensity of light leaking out of an optical cavity formed by two highly reflective mirrors. When a transmitting sample is placed inside the cavity, the change in leak-down time as light is absorbed or scattered by the sample can be used to calculate loss in the sample with resolution on the order of parts per million.
Loss can also be determined with lower accuracy using spectrophotometers or laser reflectometers by subtracting measured %T from (100%–measured %R). The accuracy of loss measurements using spectrophotometers is typically limited by the accuracy of transmission measurements, as discussed previously. High-accuracy measurements of mirror reflectivity can also be accomplished using cavity ring-down by placing the sample under test inside the cavity. This technique is often used to measure the reflectivity of laser mirrors when greater than roughly 99.95% reflectivity is required.
Coating-induced figure change
Optical coatings, even though very thin, have enough internal stress to impart significant force to the surface of the optics on which they are deposited. Too much coating stress can distort the figure of an optic and/or lead to mechanical failure of the coating itself.
For lenses and windows that have AR coatings on both sides, the net effect that the coatings have on surface figure is very small, as the forces exerted by these coatings have equal and opposite effects. Figure distortion can be a significant challenge, however, for relatively thick coatings such as dielectric mirrors, polarizers, and filters.
An effective way to measure stress is to deposit the coating onto a thin, round wafer, measure bending of the wafer after coating, and then back-calculate the stress. A significant contributor to coating stress is thermomechanical in nature, driven by elevated process temperatures and the thermal-expansion mismatch between the optic and materials in the coating. To get a good measurement of coating stress, it is often necessary to use wafers that have a thermal-expansion coefficient similar to that of the optic. The Stoney equation can be used to calculate stress in the coating from the change in radius of curvature of the wafer:
where Es= modulus of elasticity of substrate; vs = Poisson’s ratio of substrate; ts= substrate thickness; R = radius of curvature; and σf = stress in film.
The Stoney approximation assumes that the thickness of the film is small enough compared to the substrate that mechanical properties of the film can be ignored. The stiffness of the film itself, or resistance to bending, is ignored—as seen by the lack of a film elastic modulus term in the equation. The accuracy of this approximation starts to break down as film thickness and film stiffness increase. Freund and Suresh outline the limitations of the Stoney approximation in their book on the subject.7
Using their approach, we estimate that careful selection of wafer size allows for a calculated uncertainty in measured stress of less than 5% for most optical coatings. The following are some important points of note as related to post-coat surface deformation:
1. For optics that are round and have flat and parallel surfaces, the coating-stress-induced bending is almost all in the form of power (radius change). For optics of this geometry, it is straightforward to predict the post-coating figure change using the Stoney formula. More complicated geometries can be successfully modeled using finite-element analysis.
2. It is important to note that bending scales linearly with film thickness (tf) and with the square of substrate thickness (ts). Thin optics with large diameters and thick coatings have more coating-stress-induced bending.
3. Low-strain-point optical glasses have been observed to occasionally change shape plastically when exposed to elevated coating temperatures. This change in shape is not coating-stress-induced, but related to changes in the glass itself. For these optical glasses, low-temperature coating processes can be required to achieve tight figure control.
Measuring post-coat figure change
Accurately measuring the post-coat figure and roughness of precision optics is challenging. In most optics shops, form error and roughness are measured with phase-shifting interferometers. A phase-shifting interferometer collects information on reflected phase while modulating the distance between a reference and test surface. The phase information collected across the optical surface under test is used to calculate changes in surface height.
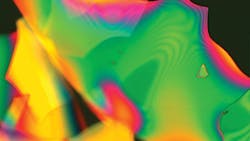
Optical coatings use constructive and destructive interference of light from a series of alternating high- and low-index-of-refraction films on the surface of an optic to achieve the desired spectral performance. Testing a surface with an interference coating using an interferometer can give a result that is erroneous and not representative of actual surface form or roughness.8,9 The exception to this is when one is measuring wavefront of a coated surface to be used at a single wavelength using a laser interferometer working at the same wavelength. The reflected phase from an interference coating can change quickly with otherwise spectrally insignificant changes in coating thickness or index of refraction. Coating nonuniformity occurs to some degree in all coating processes and, as mentioned previously, can be especially challenging on steeply curved surfaces.To quantify the degree to which an interference coating changes surface figure or roughness, the following approaches have been used successfully:
1. Measure coating stress and model the effect that the coating has on post-coat figure. When done well, this approach can be effective.
2. Flash-coat a thin metal film on top of the dielectric multilayer coating to eliminate phase effects on reflection. The metal coating can then be stripped off after testing. This technique is not ideal for some applications (high-energy laser or UV, for example).
3. Measure the uncoated back surface of the optic before and after coating to test figure change. This approach is effective but adds cost in back-surface polishing and testing.
4. Characterize post-coat surface roughness with an atomic-force microscope (AFM) instead of an interferometer. Per best practices in measuring surface roughness, careful attention must be given to spatial period filtering whenever changing measurement techniques. Also be aware that root-mean-squared (RMS) surface roughness can measure significantly lower using a small spot AFM (10–100 μm field of view) as opposed to a more standard 20x interferometric test (350 × 450 μm field of view) as a consequence of the RMS calculation.10, 11
In extremely high-quality imaging and interferometric systems, the change in phase—especially from a reflecting coating—can become a performance issue, as the wavefront at any given wavelength is a function of both surface figure and the phase change induced by the coating. It is important for such applications to consider minimizing coating nonuniformity. In coating design, a very rapid change in phase with wavelength is a danger sign. As mentioned previously, any measurement of wavefront from a coated surface other than at the wavelength of use can give nonrepresentative results. When the application requires precise control of wavefront, it is ideal (although not always financially possible) to test the coated optic in precisely the same spectral conditions as those intended in use.
Conclusion
When procuring optics, it is important to ask how the spectral performance of the coating or coatings is being measured. Ask how the vendor verifies loss in AR coatings and accuracy when measuring high reflectors. Make sure the coating vendor is using witness samples that have an equivalent index of refraction and that witness-sample placement is representative of the surface being coated. For applications where form (not phase) must be measured, avoid asking for post-coat interferometric measurements unless they are being made at the wavelength of use. For antireflection coatings, the net effect of coating stress on surface figure is very small. The effect of dielectric mirror and filter coatings on form can be significant. In these cases, understanding the coating process and resulting coating stress is important. Discussing system requirements and manufacturing tradeoffs with coating engineers before quoting is recommended to get the best overall system performance.
REFERENCES
1. A. Reule, Appl. Opt., 7, 6, 1023–1028 (1968).
2. J. Taylor, “Integrating sphere functionality: The scatter transmission measurement,” PerkinElmer technical note (2013); see http://bit.ly/1IN8xsS.
3. T. Germer et al., Spectrophotometry: Accurate measurement of optical properties of materials, Academic Press, Amsterdam, Netherlands (2014).
4. A. Voss, Appl. Opt., 33, 36, 8370–8374 (1994).
5. S. Holler, Fordham University, correspondence (Jun. 11, 2015).
6. C. Smith, University of Rochester, correspondence (May 26, 2015).
7. L. Freund and S. Suresh, Thin film materials: Stress, defect formation and surface evolution, Cambridge University Press, Cambridge, England (2003).
8. D. Savage and J. Watson, “The effect of phase distortion on interferometric measurements of thin film coated optical surfaces,” Optimax Systems Inc. white paper (2010); http://bit.ly/1Uvj16K.
9. P. Baumeister, Optical coating technology, SPIE—The International Society for Optical Engineering, Bellingham, WA (2004).
10. D. Aikens, “Meaningful surface roughness and quality tolerances,” Proc. SPIE, 7652, International Optical Design Conference (2010).
11. J. Bennett and L. Mattson, Introduction to surface roughness and scattering, Optical Society of America, Washington, DC (1989).
Pete Kupinski | Optical Coating Group Leader, Optimax Systems
Pete Kupinski is optical coating group leader at Optimax Systems (Ontario, NY).

Dr. Angus Macleod | President and CEO, Thin Film Center
Angus Macleod is President of Thin Film Center Inc, Tucson and Professor Emeritus of Optical Sciences, University of Arizona. He was born in Scotland and after graduating from the University of Glasgow he worked in research, development, engineering, production and management for several UK companies. He was Reader in Thin-Film Physics at Newcastle-upon-Tyne Polytechnic (now University of Northumbria) from 1971 and professor of Optical Sciences at the University of Arizona from 1979. In 1995 he retired from the University to devote his full attention to Thin Film Center. His technical interests are primarily in optical coatings, their design, analysis and production. He has over 200 publications in the area of optical coatings but is probably best known for his book “Thin-Film Optical Filters,” now in its fourth edition.
