Familiar to the Chinese for centuries, the dispersion of sunlight by a prism was shown by Isaac Newton in the 17th Century to result from the wave nature of light. Newton's famous experiments led to wavelength becoming the first property of light to be quantitatively measured, and Newton went on to explain the prism spectrum as the result of dispersion-the wavelength dependence of the speed of light in glass. Dispersion plays a key role in most instruments used to measure wavelength.
Instrument basics
An exception to the use of dispersion for wavelength measurement is the dual-response detector, which is essentially two detectors sandwiched together, each made of semiconductors with different spectral-response curves. The wavelength of the incident light can be determined from the unique ratio of output currents produced by the two p-n junctions. Systems based on dual-response detectors are less accurate than optically based instruments, but they have good resolution and are less expensive.
Optical instruments designed to analyze spectra at visible and near-visible wavelengths are designed around one of three basic elements: diffraction gratings, filters, and interferometers.
Diffraction gratings spatially separate the components of a light sample so that, in essence, its wavelengths can be determined by making a measurement of distance (prisms of course do this also, but are less commonly used as dispersive elements in modern instrumentation).
Filters are conceptually the simplest devices used to discriminate wavelength-only in comparatively recent times with advances in thin-film deposition technology have filters achieved sufficient resolution for cutting-edge applications.
The interferometer is the most sensitive and the most complex-a wide variety of designs produce bright and dark fringes by either combining the signal beam with a reference beam, or with a portion of the signal itself that has been made to traverse a precisely known separate optical path and then recombined with the signal beam.
Grating review
A diffraction grating is physically equivalent to a closely spaced grid of slits that acts as an array of light sources. It achieves its spectral separation by producing bright fringes at locations where the path length difference from neighboring slits is an integral number of wavelengths. The result is an angular spread of wavelengths similar in a way to that produced by a prism.
The classic diffraction grating is made by scribing a series of fine, very narrowly spaced grooves in a glass substrate. The substrate is transparent for a transmission grating and coated for a reflection grating. The behavior of a diffraction grating is summarized by the well-known equation ml = dsinq where d is the spacing between the grooves (the "slits" in the "array") and q is the angle measured from the perpendicular to the grating surface (or the direction of a light beam arriving at normal incidence).
A careful look at this diffraction equation shows that a single wavelength will be repeated in bright fringes at m different angles, where the integer m is called the "order" of the diffraction. Higher orders have greater angular separation, and therefore result in an increased ability by the grating to resolve small differences in wavelength. A "blazed" grating has the grooves shaped so as to enhance the fraction of light directed into the nonzero orders, thereby increasing the dispersion.
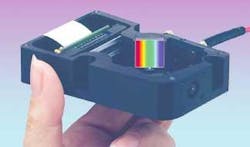
A great deal of mechanical ingenuity has gone into the design of the ruling engines capable of scribing gratings with thousands of lines per millimeter. Most recently, holographic gratings formed by first exposing the grating on photographic material have grown in popularity (see Fig. 1). If the photographic emulsion is thicker than the wavelength of the exposing light, a "volume" holographic effect can result in a grating with resolving power similar to a conventional blazed grating.
An optical workhorse
The diffraction grating phenomenon has very wide applicability in optoelectronics. Electro-optic and acousto-optic cells, for example, can be thought of as electrically controlled diffraction gratings, and tunable diode lasers use gratings embedded in the semiconductor to select the output wavelength. In test and measurement instrumentation, diffraction gratings are the dispersive elements most often used in monochromators and spectrometers.
A monochromator is used to identify specific wavelengths in a broader spectrum. A beam is passed through an entrance slit, collimated onto a grating and then refocused onto an exit slit. The grating is rotated during the measurement, so that the spectrum will scan across the output slit, thereby resolving the component wavelengths. There are many variations of this basic geometry, including the use of two gratings in tandem to improve the signal-to-noise ratio.
In its simplest form, a spectrometer is a monochromator with a detector placed at the exit slit. Most often, however, the name refers to an instrument in which the grating is not scanned and the entire spectrum is imaged onto a CCD or detector array (when the spectrum is captured on film, the instrument is called a spectrophotometer). Because it captures the entire spectrum at once, a spectrometer measurement is much quicker than that of a scanning monochromator.
The resolving power of these instruments is their ability to discriminate between two wavelengths; it is defined as the ratio of the average of the two wavelengths divided by their smallest resolvable difference. The resolving power depends on the ability of the grating to angularly disperse the spectrum, and can be shown to equal the product of the total number of grooves times the order of the diffraction being used.
Typical measurement capabilities for a spectrometer are 1-nm accuracy and 0.5-nm resolution, while a monochromator is closer to 0.3-nm accuracy and 0.1-nm resolution, although research instruments can do better. For the highest accuracy and resolution, one must turn to instruments based on interferometers. Wavemeters combine the precision of classic interferometry with the convenience of modern instrumentation.
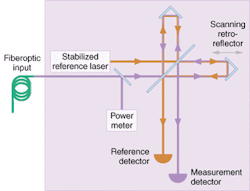
The wavemeter routes both the signal light and the output of an internal frequency stabilized laser through an interferometer. For a continuous-wave signal, a scanning (Michelson) interferometer is used and the number of fringes produced by the input beam is compared to the number produced by the known reference (see Fig. 2). For a pulsed signal, a fixed interferometer (Fabry-Perot) is used and the reference beam is chopped to match the signal. Each beam travels the same path length, and the fringe pattern results from the small difference in their wavelengths.Spectroscopy
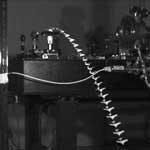
The study of spectra has been the primary tool for the noncontact study of molecular properties in the physical sciences and biology for almost two centuries. Spectroscopy uses the patterns in emission and absorption as a kind of fingerprint to identify atoms and molecules by matching the patterns with well-established predictions from quantum mechanics. The classic example is the identification of the elements in a star from the spectra of its light (see Fig. 3). Spectra are also used in the study of the dynamics of electronic transitions in the excitation of chemical formation in molecular biology, in combustion engineering, in semiconductor physics, and so on.The effects of air and other media on wavelength play a role in the accuracy of the measurement. One must be clear if a wavelength value is given in air, vacuum, or some other medium such as an optical fiber. For visible and near-infrared light, typical environmental changes in temperature, pressure, and humidity will result in a wavelength change of much less than one part per million. Environmental effects, however, can easily produce changes that exceed this value at UV wavelengths.
In addition to the familiar metric dimensions of microns and nanometers, spectroscopists work in units of "wavenumber," the inverse of the wavelength (typically as cm-1). Wavenumber is proportional to the frequency of the light and hence to the energy of the electronic orbital transition that is being studied. As such, wavenumbers can be readily added or subtracted to calculate the energies of complex, multistep transitions.
New wave
While spectroscopy remains a mainstay of the physical sciences and biology, accurate measurement of wavelength also is required by newer engineering applications. One example is the calibration of the UV lasers used for submicron lithography in fabricating semiconductor devices. Because of the nature of the optical materials used in these systems, small deviations in the wavelength at, say, 193 nm will result in a change in focus and a faulty product. Interferometeric wavemeters of the kind described above are capable of measuring pulsed laser light at 193 nm to within ~0.1 picometer.
Gratings in various forms are used extensively as passive components in optical networking. A fiber Bragg grating is a representative device-a grating is created within an optical fiber by exposing it to an intense pattern of UV light that periodically alters the fiber's index of refraction. Such gratings are used as narrowband wavelength filters and in dispersion compensation in DWDM applications.
In the area of test and measurement, the determination of wavelength is of growing importance as DWDM developers tighten channel spacing to increase communication bandwidth. Dense WDM channels must be precisely locked to wavelengths specified by the International Telecommunications Union, and not overlap with neighboring channels. In next-generation networks, with hundreds of channels crammed into a communications band, a signal source must be maintained constant to less than 5% of the spacing between channels. For the instruments used to measure wavelength, this translates to an accuracy requirement of better than ñ0.004 nm.
Measuring wavelength is often accompanied by other measurements. Wavelength meters may be paired with spectrum analyzers to characterize the spectra of telecom signals and sources. The wavelength meter is used for a fast characterization of the spectrum while the spectrum analyzer is user for narrow bandwidth measurements, such as the power and spectral distribution of side-modes.
Such narrowband measurements are an example of characterizing signals in the frequency domain, closely related conceptually to the measurement of wavelength but with its own set of techniques and instrumentation. In fact the measurement of wavelength in spectroscopy and other fields in general is paired with a need to know the linewidth. Measurements are analyzed by Fourier transformation to describe the spectral content in terms of frequency.
Next month we review methods of measuring optical frequency as well as time.
About the Author
Stephen J. Matthews
Contributing Editor
Stephen J. Matthews was a Contributing Editor for Laser Focus World.


