KENNETH E. HRDINA, CHRISTINE HECKLE, BRADFORD G. ACKERMAN, W. DAVID NAVAN, and ANDREW W. FANNING
The recently revised Intel (Austin, TX) roadmap for leading-edge lithographic feature sizes identifies extreme-ultraviolet (EUV) lithography as the primary candidate to replace argon fluoride excimer-laser-based lithography at the 32-nm node in 2009. This new technology will use an all-reflective lithographic tool including, for the first time ever, a reflective photomask (reticle). Operating at a wavelength of 13.4 nm, EUV lithography will challenge lithography designers and materials scientists with exacting thermal-management and dimensional-stability requirements.
A select few materials available to achieve the necessary dimensional stability in an EUV environment were reviewed early in the consideration of EUV technology.1, 2 The thermal loading that EUV reticles would experience was simulated, resulting in predicted image displacements based upon the thermal expansion characteristics of the materials chosen. Such simulations demonstrated the impact in terms of throughput; the research also demonstrated that the thermal concerns are not limited to temperature changes of the whole reticle, but the temperature gradients within the reticle as well. This early work identified the requirement that low-thermal-expansion materials be improved to operate at a zero coefficient of thermal expansion (CTE) for the specific operating temperature of any element in an EUV lithography system. In addition, the change in CTE (DCTE) across any one element must be uniform so as to be stable when subjected to the thermal-load gradient.
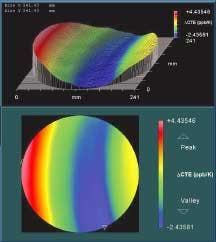
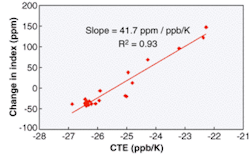
To make material improvements, it is, of course, imperative to have the capability to measure those improvements. Historically, the most economical and nondestructive technique to measure the absolute CTE and DCTE properties of an ultra-low-expansion (ULE) glass blank relied on the known correlation between CTE and the ultrasonic velocity of ULE. In recent work, it has been demonstrated that refractive-index variations in Corning ULE glass, as measured with a phase-measuring interferometer, can be correlated to CTE variations as well (see Fig. 1).3
Ultrasonic measurement
The current technique used at Corning to certify CTE in ULE glass takes advantage of the unique properties of the material to provide a nondestructive measurement. The ultrasonic technique was developed in the 1970s to measure the ultrasonic velocities that are correlated to CTE in titania-doped silica glass. This velocity is dependent on several material properties, as indicated by the following equation:
V = k[E(1 - µ)/ρ(1 + µ)(1 - 2µ)]1/2
where k is a constant, E the elastic modulus, µ the Poisson's ratio, and ρ the density.
The elastic modulus increases as the amount of titania increases, while density and the Poisson's ratio remain about the same, so velocity is a function of titanium concentration. The CTE is also strongly dependent on the titania concentration such that ultrasonic velocity is correlated to the CTE. A correlation study revealed an accuracy of ±2 ppb/K. Improvements were later demonstrated that resulted in current precision levels of ±400 × 10-12/K (or 400 parts per trillion per Kelvin, ppt/K) at one standard deviation through a 100-mm path length.
Standard practice calls for the precision of any metrology system to be at least 10 times better than the targeted specification values at three standard deviations, which is not currently the case with the ultrasonic measurement technique. The precision of ±400 ppt/K at one standard deviation is perhaps one of the best proven techniques known, yet exceeds the targeted value by a factor of 1.2 times when variations of less than 1000 ppt/K are targeted for EUV lithography low-thermal-expansion materials. The ultrasonic precision also decreases as sample thickness decreases; currently, this technique is not used on substrates with a thickness less than 40 mm because the error is too high. A third limitation is the spatial resolution. Existing equipment has a resolution of 6 mm, but an improvement by a factor of 100 would be preferred.
Interferometry correlation
In a review of traditional interferometry as used for measuring refractive-index changes in ULE glasses, it was suggested that the technique could also be a valuable tool for measuring CTE variations.4 The work presented in this article builds upon those findings by determining and quantifying the correlation between the change in index of refraction and the change in CTE of ULE glass.
The phase-measuring interferometer is a high-precision tool in which large amounts of data can be obtained quickly with a minimum amount of sample preparation, while maintaining a high spatial resolution. Corning used a Zygo (Middlefield, CT) system equipped with a 450-mm beam expander in a traditional "oil-on-flat" setup. The repeatability of the interferometric measurements was found to be better than 2 ppm, while the assumed error due to the nonmatching index oil is less than 1 ppm; the two combined account for a total peak-to-valley index error of ±3 ppm. The matching-index oil used was the same as that used for Corning HPFS fused silica (refractive index at 632.8 nm of HPFS is 1.457021, and of ULE is approximately 1.48103); in the future, this error will be minimized by using matching-index oil specific to ULE.
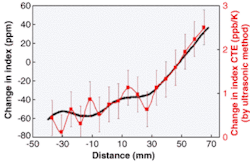
Next, the CTE was measured with the ultrasonic technique along the center axis of each sample and compared to the interferometric profile of the same axis (see Fig. 2). The index changes were measured at spacing of 225 µm and appear as an almost continuous solid black line; the ultrasonic measurements are the red square data points spaced at 6-mm increments. The error bars on the ultrasonic data represent one standard deviation of 400 ppt/K. Note that the CTE in this sample varied between about 0.5 and 2.5 ppb/K. The results showed excellent correlation between the change in index and the CTE distribution within ULE glass.Impact on industry
Used as a tool for measuring CTE within ULE glass, the interferometer will prove to be a revolutionary step change in metrology capabilities. Not only does the interferometric technique allow for extreme improvements in spatial resolution and precision, it also gives the capability to measure thinner parts. This measurement improvement—possibly the best in the world for DCTE—is essential to achieve variation targets of less than 1000 ppt/K within ULE glass.
REFERENCES
- S. E. Gianoulakis et al., Proc. 1999 SPIE Symp. Emerging Litho. Technologies III 3676, 598 (1999).
- C. . Martin et al., SPIE Emerging Litho. Technologies V 4343, 515 (2001).
- K. E. Hrdina et al., Presented at 2003 SPIE Microlithography Conf. Emerging Litho. Technologies VII, 5037 (2003).
- G. Sommargren et al., 1st Intl. Symp. EUV Lithography, Dallas (October 2002).
Kenneth E. Hrdina is senior scientist, Christine Heckle is manager of development, Bradford G. Ackerman is advanced lithography manager, and W. David Navan is product engineer, all in semiconductor materials at Corning, One Riverfront Plaza, Corning, NY 14831. Andrew W. Fanning is an optical engineer at Fanning Technical Services, Canton NY 13617. For information, e-mail: [email protected].


