The idea of optical performance monitoring is a natural extension of monitoring techniques as communication systems evolve from electronic to optical. Electronic performance monitoring checks the health of an electronic system by checking the quality of electronic signals. optical performance monitoring checks the quality of optical signals.
Things get complicated beyond that point, however, because there is no general agreement on what optical performance should be monitored or how. Should the monitor check the presence of a signal on various optical channels, the signal amplitude on an individual channel, the bit-error rate or signal-to-noise ratio on one channel, or some other quantity? Should it be done by a technician sent to the site with test equipment, by embedded equipment, or by dedicated chips or cards built into other equipment? Monitoring can have different functions—to install or upgrade services, to diagnose a malfunction, or to continually assess performance. Other variables include monitor placement and quantity. These are all open questions for carriers deciding how to monitor the optical parts of their networks.
Today's market realities amplify the uncertainties. "Exhaustive monitoring is possible with an unlimited budget," Dan Kilper of Lucent Technologies said at a workshop on optical performance monitoring he organized at the Optical Fiber Communications (OFC; Atlanta, GA) conference in March. Carriers with limited budgets must balance the capital investment in optical performance monitoring against the possible savings in operating expense from better management of a monitored network. So far, most terrestrial long-haul and metro networks continue to rely on electronic monitoring at switching points and repeaters. optical performance monitoring is common only in transoceanic submarine cables. Yet practices are evolving, and differ among carriers.
Current monitoring practices
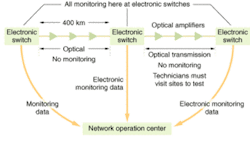
Network electronics have long included equipment that monitors signal quality by checking for bit errors or other signs of signal degradation. This function remains in the optoelectronic regenerators typically spaced about every 500 km in terrestrial fiber networks. However, electronic performance monitoring is possible only where signals are in electronic form—not on fiber spans between switching and regeneration nodes where signals remain entirely optical (see Fig. 1). Optics are needed to monitor performance along those spans, which can include amplifiers, optical switches, and optical add/drops.
Today, most monitoring is done by taking standard optical test-and-measurement equipment to sites. Technicians provisioning new services monitor signals so they can adjust optical amplifiers and other optical components as they add signals on new wavelengths. When troubleshooting, they trace signals through the series of optical amplifiers between terminal nodes, verifying the presence of signals at the proper wavelengths, and checking their quality as necessary. This approach is labor intensive, but carriers find it cost-effective because sophisticated test equipment requires a large capital investment, reaching $100,000 for some units.
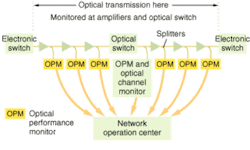
FIGURE 2. A future system with optical performance monitors (OPMs) splits off about 1% of output to an OPM at each point. Simple OPMs at each amplifier monitor use optical-spectrum analyzers to measure power levels on each optical channel, and balance amplifier gain over the spectrum. At an intermediate all-optical switch, an optical channel monitor monitors individual channels to check signal quality. All data goes back to the network operation center, which can locate faults within the optical span.
In the long term, developers would like to reduce costs to the point that dedicated optical-performance monitors could be installed at sensitive points (see Fig. 2). The units would continually monitor optical signals, sending data back to the operations center. If a unit recognized an anomaly, it would trigger an alarm in the operations center. Ideally, some problems could be fixed by issuing commands from the control center, such as shifting a signal to a different wavelength. If on-site maintenance is needed, the monitor should try to diagnose and locate the fault to speed repairs. Such monitoring should cut operating costs—if carriers can afford the investment. Kilper said the target price for embedded units is around $10,000—a factor of 10 lower than for discrete test equipment.
So far, virtually the only systems using remote optical performance monitors are ultra-long-haul submarine cables, where optical signals travel thousands of kilometers on the inaccessible sea floor. The monitors can automatically locate optical channels, measure channel wavelengths, tune the gain spectrum of optical amplifiers, and locate faults. The next likely applications are in ultra-long-haul terrestrial systems, which span similar distances on land, but few are being built today.
Types of optical monitoring equipment
Typically, optical signals are monitored by tapping a small part of the signal after an amplifier (see Fig. 1). The functions that an embedded monitor should perform are still a matter of debate.
FIGURE 3. An optical spectrum analyzer spreads out a spectrum showing optical channels in use. In this case, the fourth channel from left is weak, and the sixth channel from left is vacant, with only a small crosstalk noise. Control systems or the network operating center can use this information to equalize gain or identify faulty channels.
Virtually everyone agrees on the importance of optical-spectrum analysis, which measures the signal power as a function of wavelength in the operating window. In the simple unit shown in Fig. 3, a diffraction grating spreads out the spectrum and onto a linear sensor array, so each element measures the power over a small range of wavelengths. With proper calibration this gives the intensity on each standard optical channel. Alternatively, a single detector can continuously scan the spectrum. These measurements of power on each optical channel can be used to balance optical-amplifier gain across the spectrum, a critical function for a long chain of amplifiers in which a few strong channels could dominate the final output. More elaborate optical spectrum analyzers can measure noise between channels and on unoccupied channels, and measure the wavelength of each signal precisely to be sure it is properly placed in its channel.
The need to monitor the quality of signals on individual channels is subject to more debate. This requires isolation of individual signals, either by filtering out all but one optical channel, or by physically separating the wavelengths. The most exacting approach is to directly monitor bit-error rate on one channel at a time, but this requires an expensive bit-error-rate tester that needs a long time to count enough bits for a reliable measurement. One alternative is to look at the optical signal-to-noise ratio. Another is to measure the "Q margin," which assesses how much forward error correction is needed to clean up the signal at the receiver, said Karl Toompuu, director of product line management at Ceyba (Ottawa). Both techniques give useful approximations of the bit-error rate, but don't spot everything. The Q margin, for example, does not spot dispersion-caused intersymbol interference that causes "one" bits to have high and low levels, showing up as a bar on the eye pattern, said Toompuu. Potential standards are being debated, as well as the need to examine every bit to assess signal quality.
The use of forward error correction (FEC) in optical systems affects how their performance degrades. Electronic systems without forward error correction degrade gradually, with a slow increase in bit-error rate giving advance warning of failure. The FEC hides the signs of gradual degradation in optical systems, although it has to work harder to keep the output signal error-free as the raw error rate increases. This behavior complicates the task of monitoring long-term trends to warn of deterioration.
Current monitors don't see the effects of chromatic dispersion directly, which can make it difficult to identify failures arising from errors in compensation. Some techniques to overcome this limitation are under consideration, but Kilmer said it's tempting to say, "what could go wrong, it's only a piece of fiber" used for compensation.
Polarization-mode dispersion is a different matter. It varies with environmental conditions, and peaks in bursts long enough to overwhelm forward error correction, making it important to monitor. Polarization-mode dispersion or PMD can affect some 10-Gbit/s systems, but does not become a widespread problem until data rates reach 40 Gbit/s, making PMD monitoring more a concern for the future. Another possibility is monitoring for the presence of optical taps in secure systems said Alan Willner of the University of Southern California at the OFC workshop.
A major long-term issue is reducing costs enough that embedding optical performance monitoring becomes practical. That requires integration of optical capabilities. NanoOpto (Somerset, NJ) is developing a family of components based on diffraction from nano-scale structures, including polarizing optics and tunable filters. They can be stacked together to make a wafer-scale optical-performance monitor that performs multiple functions. Hubert Kostal, vice president of marketing and sales, envisions chips costing $100 to $200 that could perform the same functions as a $10,000 optical monitoring card, such as checking for signals at particular wavelengths. At OFC, J. Wang of NanoOpto described electrically tunable notch filters that swept across a 30-nm range. Kostal said a commercial version should be the size of a shirt button and sell for under $500.
Implementation plans
Implementation of optical performance monitoring will depend on network management and maintenance procedures, and those vary widely among carriers. Toompuu said some carriers equip each field team with all the test equipment they need, while others store expensive gear at a few depots and fly someone there to collect it on the way to fix an outage. Companies facing the same tradeoffs make different choices. Kilper said that AT&T allows its maintenance group to veto equipment purchases, while Worldcom is more flexible. He noted that some carriers don't even manage their own networks.
Carriers have yet to decide how to deploy monitors. One may be needed at every amplifier if their main purpose is tuning the amplifier, Kilper said. But they may be installed at wider intervals if they perform functions such as monitoring data quality throughout the network. Those monitors might better be spaced every 400 to 800 km, at points where dynamic gain equalization is required. Signal quality might need to be examined at optical add/drop multiplexers.
Although many carriers are considering extensive monitoring, Kilper said monitoring requirements might be reduced by carefully characterizing all components and designing systems with enough margin that nothing should go wrong. Ceyba is integrating performance monitors into its long-haul systems. "We measure power everywhere," said Toompuu, assessing the noise present at each wavelength. They also integrate an optical time-domain multiplexer to automatically spot fiber breaks.
ACKNOWLEDGMENTS
Thanks to Dan Kilper, Lucent Bell Labs; Hubert Kostal, NanoOpto; and Karl Toompuu, Ceyba for helpful information.


