NONLINEAR OPTICS: The dream of a turnkey nonlinear spectrophotometer gets closer to reality
ERIC VAN STRYLAND, DAVID HAGAN, AND SETH MARDER
For researchers in nonlinear optics, one of the “holy grails” would be an instrument that could measure absorption changes in a material as a function of high-irradiance light over a broad spectrum of wavelengths. This so-called nonlinear spectrophotometer would be analogous to the existing linear absorption spectrometer. Such an instrument is now within sight.
Nonlinear optics (NLO) is the study of materials with optical properties (for example, absorption and refraction) that depend on the intensity of incident light. A common example of a nonlinear optical material is glass or plastic photochromic sunglasses. In this case, the material is a nonlinear absorber because its absorption coefficient changes upon illumination with bright light. However, the process in this material is slow (taking many seconds) and usually weak (change in transmittance is less than a factor of 10). If such a process could be made much faster and stronger, it could find many applications, such as in optical switching.
In the search for “better” nonlinear optical materials, it is important to be able to characterize their nonlinear properties rapidly over a broad spectral range. The most common method for performing these measurements is the Z-scan, which is capable of measuring both nonlinear absorption and refraction at a single wavelength (see “Z-scan measures nonlinear properties”). To map these properties across the entire spectrum, scientists use a tunable source, usually an optical parametric amplifier (OPA), and perform successive experiments at different wavelengths. However, such experiments are time-consuming—mainly due to the tuning and realignment of the OPA—and require complex instrumentation and highly trained personnel.
The NLO spectrophotometer
A longtime dream of ours for nonlinear optics is to build an NLO spectrophotometer that would enable a technician to open a door, put in a sample, push a button, and return a few minutes later to read the nonlinear absorption spectrum over a wide bandwidth. Spectrally bright femtosecond, white-light continua (WLC) now make this type of instrument feasible. Such WLC have long been known to result from propagation of short pulses in condensed matter, but usually have been used as weak, broadband probing pulses. However, recent advances in the development of high-power ultrafast lasers have led to the development of intense WLC via propagation of high-energy short pulses in noble gases.
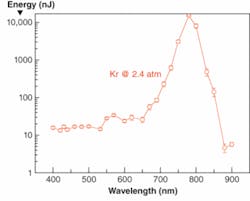
We produced one such WLC by weakly focusing approximately 1 mJ, 100fs pulses at 775 nm from a Ti:sapphire laser into a 1 m cell filled with 2.5 atmospheres of krypton (Kr) gas, giving nearly 100% conversion to white light spanning an octave from 400 to 800 nm. This WLC has enough spectral irradiance within any chosen 10 nm bandwidth in that range to perform nonlinear experiments—in particular for us, nonlinear absorption experiments. Although the entire continuum exhibits considerable chirp (different colors arrive at the sample at different times because they travel at different speeds in the gas), any 10 nm bandwidth extracted using narrowband filters is near-bandwidth-limited and has a pulsewidth that mimics the excitation source at approximately 100 fs. Remarkably, the spatial profile of this continuum at any wavelength in this range is nearly Gaussian, making it easy to model nonlinear propagation (see Fig. 1). We suspect that self-focusing in the gas is stabilized by a small degree of gas ionization, which leads to self-defocusing. Thus, the beam remains at high irradiance over a long path length within the cell, leading to excellent energy conversion to the WLC.
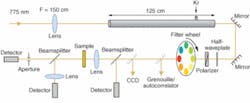
To use this continuum for nonlinear spectroscopy, the wavelengths need to be separated. To understand why, consider the case of frequency-degenerate two-photon absorption (2PA), which is the simultaneous absorption of two equal-energy photons. If all of the wavelengths from 400 to 800 nm were simultaneously present in an experiment, the absorption frequency (and thus the photon energy) resulting from degenerate 2PA would be indiscernible from the absorption of two nondegenerate photons having different energies. The separation of the different frequencies can be accomplished in several ways: in space by using gratings or prisms; in time, using group velocity dispersion in materials or grating pairs; or by using dielectric filters. We tried all of these but settled on the simplest method of spectral filtering using dielectric filters of approximately 10 nm in bandwidth, which is chosen at any wavelength range so as to support near-bandwidth-limited pulses of 100 fs.1, 2 To that end, we simply purchased about 40 filters that cover the entire octave in frequency and put them on a large filter wheel driven by a stepping motor (see Fig. 2).The primary value of this method over the use of an OPA is that, because the WLC is generated in a single filament in the gas, the spatial profile is excellent over the whole visible wavelength range and, most important, all wavelengths are collinear, so that the experimental system does not need to be realigned upon changing wavelengths. A major failing of OPA systems is that the beam shape, position, and pulsewidth tend to change significantly upon tuning.
This setup is particularly well suited for performing Z-scans in which the sample is scanned along the focused light beam to change the irradiance within the sample. Such methodology allows for both “open-aperture” Z-scans to determine the strength and magnitude of the nonlinear absorption, and “closed-aperture” Z-scans to determine the sign and magnitude of the nonlinear refraction. Thus, our nonlinear spectrophotometer can accomplish what the linear spectrophotometer cannot—give information on refraction and absorption simultaneously at each wavelength within the WLC. A linear spectrophotometer would require the user to invoke “Kramers-Kronig relations,” mathematical properties that connect real and imaginary variables in complex functions. The fact that this WLC has a Gaussian spatial profile is particularly fortuitous for Z-scans and other nonlinear experiments. Of course, this setup could enable other nonlinear measurements such as pump-probe, coherent anti-Stokes Raman scattering (CARS), and so forth.
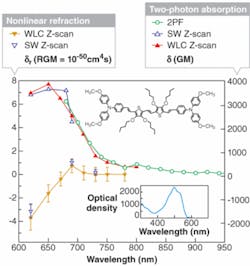
We obtained the 2PA spectrum and dispersion of nonlinear refraction of the organic material using multiple methods, and the results of all these methods were in agreement (see Fig. 3). At wavelengths below 600 nm, the linear absorption spectrum shows that light is linearly absorbed by the sample, making nonlinear measurements impossible (see Fig. 3, inset).3 In addition, the zero in the nonlinear refraction occurring near the peak of the 2PA is reminiscent of linear Kramers-Kronig relations where the index of refraction is related to an integral of the absorption over all frequencies. The fact is, degenerate nonlinearities cannot be used in this way; however, qualitatively the structure is satisfying.One future development for this instrument is to fully automate it. This will require the addition of variable neutral-density filters to adjust the irradiance at different wavelengths and the computer code for automation. The extension of the wavelength by another octave into the near-infrared at 1.6 µm would also find many uses.
ACKNOWLEDGMENTS
The authors thank Seth Marder for the sample in Fig. 3. 4
REFERENCES
1. M. Balu et al., Opt. Express 12, 3820 (2004).
2. M. Balu et al., Opt. Express 13, 3594 (2005).
3. M. Balu et al., JOSA B 25, 2, 159 (2008).
4. S. Zheng et al., Chem. Commun. (Cambridge) 13, 1372 (2007).
ERIC VAN STRYLAND is dean and DAVID HAGAN is associate dean at CREOL, The College of Optics & Photonics, University of Central Florida, 4000 Central Florida Blvd., Orlando, FL, 32816-2700; e-mail: [email protected] and [email protected]; www.creol.ucf.edu. SETH MARDER is professor of chemistry at the Georgia Institute of Technology, 901 Atlantic Dr., Atlanta, GA 30332-0400.
Z-scan measures nonlinear properties
The Z-scan is a simple method to measure nonlinear absorption (NLA) and nonlinear refraction (NLR). The so-called “open aperture” Z-scan has the aperture removed to measure NLA. With an aperture in place, the “closed aperture” Z-scan measures NLR. The “D” denotes a detector.The sample is scanned along the optical axis to vary the irradiance (W/cm2) on the sample and the energy transmitted is collected. If all of the energy is collected, the losses are due to absorption including NLA and possibly nonlinear scattering. (For simplicity here we consider samples exhibiting low scatter.) If the energy is collected through an aperture, the loss can be modulated by refraction, which causes diffractive lensing in the sample; the beam can become smaller or larger in the far field depending on the position of the sample. If the nonlinear absorption value from the open aperture Z-scan is known, the changes in transmittance in the closed-aperture Z-scan then give the NLR. Some very simple methods of analysis avoid lengthy calculations for standard third-order nonlinearities. The rather remarkable sensitivity of this technique (λ/1000 has been achieved) arises because diffraction of the phase mask at the sample results in constructive interference between different spatial portions of the beam in the far field. In other words, Z-scan has interferometric sensitivity.


