CONFOCAL MICROSCOPY: Dual-detection confocal fluorescence microscope needs no axial scanning
One of the most effective ways to observe living tissue is by using a confocal fluorescence microscope, which allows detailed 3D fluorescence information to be captured and used to reconstruct 3D images. However, because a confocal microscope must normally be scanned in three dimensions, biological samples can be photobleached, damaged, or even killed by the large amount of light received.
Four researchers at the Korea Advanced Institute of Science and Technology (KAIST; Daejeon) and Hanyang University (Seoul) have greatly lessened the problem of light toxicity in confocal fluorescence microscopy by creating an instrument that only needs to be scanned in two dimensions (x and y) rather than in all three (axial, x, and y). The researchers, who include Dong-Ryoung Lee, Young-Duk Kim, Dae-Gab Gweon, and Hongki Yoo, achieve this by using two pinhole-covered photodetectors, each pinhole of a different size and thus a different axial response. Axial information from emitting points is obtained by looking at the ratio of intensity signals from the pinholes and using their axial response to place the depths of the points.
In the technique, called dual-detection confocal fluorescence microscopy (DDCFM), the two pinholes are a fixed axial distance apart. The ratio of the signals from the two detectors is the relevant measured parameter; thus, characteristics such as a fluorescent sample’s quantum efficiency drop out of the calculations and a simple response curve results.
180 μm depth range
The experimental system was based on pinhole diameters of 30 and 150 μm; a 488-nm-emitting laser was the light source. Two-dimensional scanning was done with a galvanometer mirror and an 8 kHz resonant mirror, resulting in 15.6 frames/s, each frame with 512 × 512 pixels. The field of view was 4000 × 4000 μm.
Along with the pinhole size, the axial response curve depends on the numerical aperture (NA) of the objective. Long axial measurements were accomplished using an objective with a low NA of 0.045. Photomultiplier tubes (PMTs) were used to capture the fluorescent signals.
First, the axial response was measured by looking at widely spaced 6 μm fluorescent beads, scanning in x and y while adding an additional 300-μm-deep axial scan with a piezoelectric stage (used only for characterization). A fifth-order polynomial was fitted to the data to form a calibration curve. The result was a 180 μm axial measurement range.
After additional calibration measurements, various images were taken to demonstrate the 3D imaging capabilities of DDCFM. A prepared sample with fluorescent beads at two different heights 150 μm apart and spread laterally over a wide 2D area was imaged; the mean measured height difference was 150.6 μm.
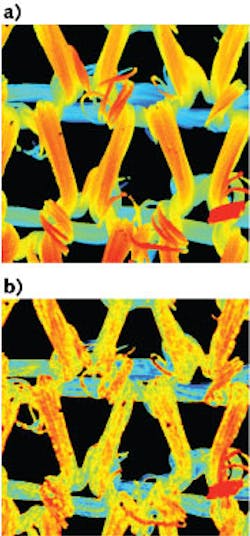
To see how well the instrument could handle 3D structures, the researchers imaged a knitted nylon fabric stained with fluorescein. Image versions were taken spanning a 4000 × 4000 μm field of view with the 0.045 NA objective. The results clearly showed details of the fabric structure. Comparisons with scans taken with a conventional 3D scanning confocal fluorescence microscope showed comparable results (see figure).
The one disadvantage of the DDCFM technique is that if there is more than one fluorescent point along an axial line (for example, if the sample is partly transparent), then the results may not be accurate; in this case, the researchers expect that the closest fluorescent point will likely be the one measured. The researchers believe that DDCFM can be miniaturized to create a compact endoscopic 3D fluorescence imaging probe using fiber optics for preclinical and clinical research.
“Since we think the best part of the presented technique is the capability of fast 3D imaging, we will first try to get a movie that shows dynamics of fluorescent particles,” says Dong-Ryoung Lee of KAIST.
REFERENCE
1. D.-R. Lee et al., Opt. Exp., 21, 15, 17839 (July 29, 2013).
About the Author
John Wallace
Senior Technical Editor (1998-2022)
John Wallace was with Laser Focus World for nearly 25 years, retiring in late June 2022. He obtained a bachelor's degree in mechanical engineering and physics at Rutgers University and a master's in optical engineering at the University of Rochester. Before becoming an editor, John worked as an engineer at RCA, Exxon, Eastman Kodak, and GCA Corporation.

