Beam Profiling: Second-moment method characterizes higher-order beam modes
GREGORY E. SLOBODZIAN
In the past quarter-century, CCD cameras have become popular tools to image and quantify laser beams. During this period, both camera technology and the analytical methods used to perform the most basic beam measurements have seen many changes.
About 10 years into this evolution, the International Organization for Standardization (ISO) published ISO standards 11145 and 11146. ISO 11145 created a set of definitions for various laser beam terms, symbols, and units of measurement. ISO 11146 described a method for measuring beam widths, divergence, and the beam quality factor (m2). This second standard necessitated measuring laser beam widths according to the so-called second-moment method, in which energy vs. distance from the centroid of the beam is integrated to obtain a properly weighted beam width.
During these early years, a number of different beam-width measurement methods were adopted by the industry. Typically, these beam-width definitions were unique to various laser manufacturers, system integrators, and end users. Those involved in the development of laser-beam-analysis instruments would often incorporate algorithms to meet customer needs—even some that seemed dubious. Within a few years, measuring beam widths using the second-moment method became most significant. There already existed a number of second-moment "equivalent" methods. Most common among these equivalent methods are:
- 13.5% of peak
- 86.5% of total power/energy
- Knife edge based on set high/low clip levels times a correction factor
However, these methods are only "correct" when applied to Gaussian single-mode (TEM00) beams. Laser beams consisting of higher modes are not as accurately measured with these methods. The advantage of these equivalent methods is that they are compatible with CCD cameras. This means that they are not highly susceptible to the main limitations of CCD cameras, which are:
- Mediocre signal-to-noise
- Black-level baseline ambiguities
- Baseline drift
- Pixel-to-pixel offsets
- Area shading effects
The output from early cameras was interlaced RS-170 or CCIR monochrome analog video that required a well-designed video digitizer/frame-grabber interface. The need for a frame grabber has been a factor in the evolution of today's megapixel progressive scan digital cameras with USB 3, FireWire, or Gig-E serial interface. Included in these improvements are specific controls for adjusting the black level, gain, and other camera features, plus higher signal-to-noise ratios that allow for 12- and 14-bit outputs that digitize well into the video noise.
These improvements have helped to make it easier for a beam analyzer to directly compute second-moment beam widths. Two image-processing techniques are needed to achieve accurate results.
First, the video black level needs to be computed with a high degree of accuracy to establish a black baseline with preserved positive and negative noise components. ISO/TR 11146-3:2004(E), section 3.3, describes how to establish an accurate black-level baseline. This method was also developed by Spiricon and was patented in the mid-1990s. Averaging a large number of frames can resolve a baseline to per-pixel fractional counts and thus help to eliminate fractional offset errors that are inherent in the quantization process.
Second, the region on the imager that contains the beam image needs to be isolated from regions outside of the beam to remove the effects of small and random fluctuations in the black baseline computed in the first step above. ISO 11146-1:2005(E), section 7.2, instructs that the integration integrals should be carried out over an area limited to 3x the beam widths in the x and y directions. This second requirement is due to the nature of the second-moment integral, which contains a multiplying factor. This factor is the square of the distance that a pixel lies from the centroid. A small positive or negative bias over many thousands of pixels located at large distances from the beam centroid can significantly impact the computed beam results. Likewise, small stray rays in these distant regions can also have a dramatic impact on the final results.
This spatial limiting process effectively apertures the beam from the regions where the beam isn't. In the mid-1990s, before ISO addressed this subject, we experimented with how to size this isolating aperture and eventually incorporated it into our software as an auto-aperture feature. Our results differed from the ISO recommendation; the balance of this article will discuss how we came to this conclusion.
Aperturing TEM00 beams is natural starting point
All beam-analysis algorithm studies naturally begin with the Gaussian TEM00 beam. It is the easiest to model and good real-world near-TEM00 beams are available from high-quality helium-neon (HeNe) lasers. In one method developed by us to quickly assess the performance of a beam-measurement algorithm, a beam's intensity was adjusted so that its peak was just below camera saturation. The beam intensity was then reduced to see how well the beam-width measurement would track as the signal-to-noise ratio degraded. Obviously, the measurement should begin at a high accuracy and then remain reasonably stable as the peak intensity drops.
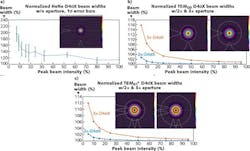
Figure 1a shows a plot of a normalized x-axis second-moment (D4σX) beam width vs. peak intensity for a HeNe laser without the use of an isolating aperture. The camera is a high-quality 2 Mpixel CCD with a signal-to-noise ratio of 61 dB root-mean-squared (dBrms). The baseline is normalized; however, some small positive offset is present and causing the results to be more than 10% larger than the actual beam size. In this case the offset is positive, but could just as likely be negative. The positive offset is likely caused by the camera imager still warming up. This points to the need not only for aperturing, but also for good temperature stability when making long-term measurements.
Figure 1b is a plot of a normalized D4σX beam width for a modeled TEM00 beam with both a 2x and a 3x aperture. The model is replicating a 12-bit camera with a signal-to-noise ratio of 60 dBrms. These specifications are typical for a modern good-quality CCD camera. Both positive and negative noise is preserved and a +½ count positive offset has been added to the baseline to simulate a typical camera's short-term fluctuation. The fluctuations can go both positive and negative, but these plots will only show a positive shift. Flipping the data around the 100% axis would show how things look with a -½ count bias.
A plot of a modeled TEM01* (m2=2, donut) beam with both a 2x and a 3x aperture is shown in Fig. 1c. It can be seen in Figs. 1b and 1c that the 2x aperture yields a more-accurate result compared to the 3x aperture. However, both the 2x and 3x apertures yield reasonably good accuracy (under +5%) with intensity as low as 15% of peak. This indicates that either aperture size would perform well as long as the dark field near the beam is clear of stray background reflections or pump glow.
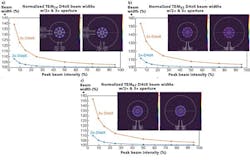
Figure 2a is a plot of a modeled higher-order Laguerre TEM24 beam (m2=9). The 3x aperture is now growing quite large compared to the actual area of the beam. The accuracy is now down to 5% at 50% intensity for the 3x aperture, while the 2x shows good accuracy all the way down to 10% intensity.Figures 2b and 2c show two different Laguerre beams, both with an m2=16. They are configured as TEM55 and TEM47, respectively. Beam accuracy for the 3x aperture now begins to degrade, even at quite-high beam intensities. The 3x aperture leaves very large no-signal regions around the beam profiles. These enclosed no-signal regions can yield large measurement fluctuations as the camera baseline noise bounces in the background and invites added errors for any stray light in these areas.
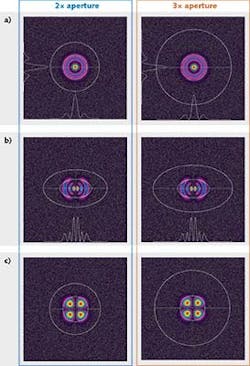
Figure 3 shows a collection of other modes with both 2x and a 3x apertures. The larger 3x empty regions around many of the higher-order modes are an invitation for offset errors and stray light to degrade accuracy. In many cases, even a 2x aperture can invite trouble, although always less trouble than a 3x aperture.We chose to only model beams with individual modes for simplicity. In reality, few real lasers contain just a pure higher mode. It has been demonstrated that beams build higher modes in a more or less systematic way based on the design of the lasing cavity. Thus, as the higher modes increase, the structures become even more complex than what is demonstrated above. As the modal complexity increases, the beam widths increase relative to the area the beam covers. As a result, any multiplied aperture increases even faster.
2x aperture yields better results
What we have looked for in this article is a simple rule that can be applied for isolating and accurately calculating the second-moment beam widths of laser beams imaged on CCD cameras. While ISO recommends a 3x isolating region, we have found that a 2x aperture yields better results over a wider range of real laser-beam measurement conditions.
There are other approaches that could be used to customize an isolating aperture based on the unique nature of the beam being measured. Other techniques have been discussed, both in and out of print. Some require complex iterative processes to find the "best" size, independent of any multiplication rule. We have experimented with some iterative processes in the past and find that they consume more computational power and do not yield significantly superior results, which isn't to say that perhaps a better mousetrap—or rather "beam trap"—doesn't exist.
Today's laser-beam analyzer programs are loaded with features and are thus large and complex pieces of software. Many features, all attempting to run in real time, compete for processing time. Frequently, third-party applications are also running and demanding processor overhead. As a result, the notion of keeping things simple is compelling.
REFERENCES
1. C. B. Roundy, "Techniques for accurately measuring laser beam width with commercial CCD cameras," Proc. SPIE, 3405, ROMOPTO '97: Fifth Conference on Optics, 1045 (Jul. 2, 1998); http://dx.doi.org/10.1117/12.312711.
2. ISO 11146-1:2005(E), "Lasers and laser-related equipment—Test methods for laser beam widths, divergence angles and beam propagation ratios—Part 1: Stigmatic and simple astigmatic beams" (Jan. 15, 2005).
3. ISO/TR 11146-3:2004(E), "Lasers and laser-related equipment—Test methods for laser beam widths, divergence angles and beam propagation ratios—Part 3: Intrinsic and geometrical laser beam classification, propagation and details of test methods" (Feb. 1, 2004).
4. ISO/TR 11146-3:2004/Cor.1:2005(E), "Lasers and laser-related equipment—Test methods for laser beam widths, divergence angles and beam propagation ratios—Part 3: Intrinsic and geometrical laser beam classification, propagation and details of test methods" (Feb. 15, 2005).
5. A. E. Siegman, "How to (maybe) measure laser beam quality," Proc. DLAI, paper MQ1 (1998).
6. A. E. Siegman, M. W. Sasnett, and T. F. Johnston, IEEE J. Quantum Electron., 27, 4, 1098–1104 (Apr. 1991).
Gregory E. Slobodzian is director of engineering (retired) at Ophir-Spiricon, North Logan, UT; e-mail: [email protected]; www.ophiropt.com.


