OPTICAL SCATTEROMETRY: How far can one go with optical metrology?
JON OPSAL
It has been known for some time and appreciated more fully in recent years that one could characterize periodic line-space structures using optical scatterometry.1-5 A key question, however, has been just how small can one go with optics in terms of feature size and pitch. The simple answer, of course, is that if optics can produce it, then optics should be able to measure it. As the following simple examples suggest, the limits of optics-based measurements are not so much due to wavelength but rather to the signal-to-noise ratio of the measurement system and the types of measurements being made—in particular, spectroscopic ellipsometry and polarization-resolved angular-dependent reflectometry/ellipsometry.
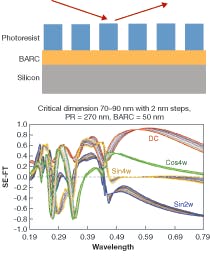
A beam of light incident on a periodic line-space structure is diffracted by the structure and a portion of that diffracted light is specular (see Fig. 1). The amount of specular light is a measure of how much light is diffracted away from the specular direction and as such is a measure of the total amount of light scattered out of the main part of the beam. For periodic structures (arrays) the diffracted light is characterized in terms of diffraction orders, which depend on the wavelength and pitch of the array. For wavelengths larger than the pitch, the diffracted orders become evanescent and are confined to the structure.
In this region the only light coming from the sample is the specular (or zeroth order) component. For wavelengths shorter than the pitch the diffracted orders begin to propagate away from the structure with the number of propagating diffracted orders increasing with decreasing wavelength. Although a real measurement system always has a finite aperture and is susceptible to collecting scattered light with overlapping diffraction orders, in practice, most spectroscopic systems have a numerical aperture on the order of 0.1 and only see the zeroth order.
Interesting sensitivities
Simulations were made of the response of a broadband rotating compensator spectroscopic ellipsometer (RCSE) described in Reference 2 (see Fig. 1). The four signals obtained from this type of system produce three independent pieces of information about the polarization state of the light incident on the detector: the in-plane (P) and out-of-plane (S) components of the reflected light and the phase difference between the P and S components. The angle of incidence for this system is fixed at 65° from the normal with a half-angle illumination and collection cone of 6°. Although all of the signals show sensitivity to small 2 nm changes in the width of the line (critical dimension), the nature of the sensitivities is most interesting.
When one signal (such as sin4w) shows a weak sensitivity to changes in critical dimension, one or more of the other signals (sin2w and DC) will often show a strong sensitivity. Furthermore, the sensitivities are distributed across the entire spectral range shown (190 to 790 nm). That is, there is no strong wavelength preference. The entire spectrum is rich in information and, as appreciated by many working in this area, often desired and required for making accurate and robust measurements.
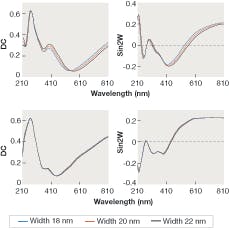
Assuming this same kind of photoresist structure, let’s now consider what happens when the dimensions are much smaller: 20 nm linewidths for dense (40 nm pitch, LS 1:1) and isolated (180 nm pitch, LS 1:9). For the dense structures, 2 nm changes about the 20 nm target are clearly discernable (see upper set of plots in Fig. 2). The sensitivities are surprisingly close to those shown in Fig. 1 and within the reach of a 1% measurement system. However, the needs of the semiconductor industry are not absolute. They are relative and require that measurement capabilities scale accordingly.The required sensitivity at the 20 nm linewidth will likely be less than 0.1 nm and this implies measurement systems at the level of 0.1% or better (see lower set of plots in Fig. 2). The sensitivities are about one-third of those shown for the dense structures. Many of today’s systems are close to this required level of performance and systems on the horizon will likely get there. The ultimate spectroscopic measurement system will probably get to the 0.01% level, but there will be measurement ambiguities that no amount of precision will be able to resolve, especially for three-dimensional isolated and aperiodic structures. Additional independent measurements will be needed.
Different points of view
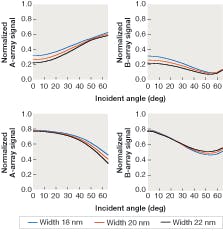
Consider now a system that looks at a sample from different spatial points of view at a fixed wavelength. Assume a 200-nm-wavelength laser illuminating a simple polygate structure (80 nm poly on 2 nm oxide-on-silicon substrate) with light polarized along the grating axis coming in at different angles of incidence and two different azimuth angles: plane of incidence along the grating axis and plane of incidence perpendicular to the grating axis.
Simulations were made of 18, 20, and 22 nm linewidths for both dense (upper set) and isolated (lower set) structures (see Fig. 3). The plots on the left are for the plane of incidence perpendicular to the grating axis and those on the right are for the plane of incidence along the grating axis. For the dense structure the scattering is very significant with about 40% to 90% of the light being scattered depending on the width of the line, angle of incidence, and plane of incidence.With the 0.01% precision that one can expect from a laser-based measurement system, a wide range of incident angles and multiple planes of incidence, it seems clear that this kind of configuration (especially if one adds elements for obtaining ellipsometric data) has the potential to readily meet the anticipated requirements of the semiconductor industry for the next several years (see Fig. 3, lower set of plots). The sensitivity to changes in critical dimension is still there, albeit now at the larger angles of incidence.
Overall, a spectroscopic, fixed-angle-of-incidence measurement system is a little like doing radar and gauging things by the time it takes for the signal to return after interacting with the target. Essentially, one has phase and amplitude information at a variety of wavelengths that, when superposed, gives an approximation to an impulse response function. The line shape of that response contains information about the size, shape, and orientation of the scattering object. Wavelength is important but it is more important to have a broad range of wavelengths and very precise data at each one of those wavelengths to ensure a robust and accurate reconstruction of the target.
A significant improvement can be made by making measurements at multiple viewing angles—that is, multiple angles of incidence and multiple planes of incidence. This is a little like doing tomography, in which the reconstruction of the target depends critically on the quality and spatial completeness of the data. This latter type of system is appealing in its simplicity and potential for rapid data acquisition in a small measurement area. It is even more appealing in that it can easily be combined with spectroscopic methods.
REFERENCES
1. K.P. Bishop et al., Proc. SPIE 1545, 64 (1991).
2. J. Opsal, H. Chu, Y. Wen, Y.C. Chang, G. Li, Proc. SPIE 4689, 163 (2002).
3. W.D. Mieher, T.G. Dziura, X. Chen, P. DeCecco, A. Levy, Proc. SPIE 4689, 957 (2002).
4. V. Machavariani, S. Gov, Y. Cohen, Proc. SPIE 4689, 177 (2002).
5. J.M. Holden, T. Gubiotti, A.A. McGaham, M. Dusa, T. Kiers, Proc. SPIE 4689, 1110 (2002).
Jon Opsal is the CTO of Therma-Wave, Inc., 1250 Reliance Way, Fremont, CA 94539; e-mail: [email protected]; www.thermawave.com.


