Program integrates lidar data for display
Program integrates lidar data for display
William Eichinger, Nancy Collins, Rich Sefecka, and Howard Kraye
The Visualization Data Explorer allows researchers to tame large data files, leading to new insights and efficient data analysis.
A pioneering traffic-management study in Minnesota, the Guidestar project, uses light-detection-and-ranging (lidar) techniques to determine the environmental impact of applying ad vanced traffic-management technologies to urban transportation systems. Lidar is an information-rich but data-intensive technology; in a typical session, as much 1.5 Gbits of data are produced. Before scientists can perform a detailed numerical analysis of the results, a large-scale assessment of the data must be made.
The IBM Visualization Data Explorer is the primary visualization and analysis software package used for data evaluation in the Guidestar program. Flexible and interactive, the system offers a wide variety of processing, realization, and rendering capabilities through different interfaces such as visual programming, scripting language programming, motif "widgets," and an advanced programming interface.
The program is currently available in versions for UNIX workstations produced by Sun, Silicon Graphics, IBM, Hewlett-Packard, Digital Equipment Corp., and Data General. Version 3.1 of the software provides support for parallel-distributed computing on networks, workstation clusters, distributed-memory systems, and parallel-shared-memory multi processors from IBM, Sun, and Silicon Graphics.
Data Explorer (DX) employs a visual programming and "data-flow" approach to visualization and analysis. Data flow is a way of decomposing processing tasks into convenient, self-contained, data-oriented modules that are invoked by user command. A graphical user interface connects modules together to create an architecture capable of meeting specific user requirements.
Interfacing between DX and standard mathematical, statistical, and graphical data-analysis packages is straightforward. A number of public-domain interfaces are directly supported by the DX import module, including common data format (CDF), network common data format (netCDF), hierarchical data format-scientific data set (HDF-SDS), and the DX native format. In addition, DX can import several standard image formats such as RGB and TIFF files. Interfaces with other software packages are also available.
The program can work with many different classes of scientific data. These are identified within DX by shape (size and number of dimensions), rank (scalar, vector, tensor), type (floating point, integer, byte, real, complex, and quaternion), position (location of the elements in dimensional space), connections (how these locations are related to each other), mesh dependency of data (node or cell center), and aggregation (hierarchies, series, composites, and multiple grids). To provide graphics and imaging operations within the context of DX, the program supports regular, irregular, structured, and unstructured data, as well as the notion of missing data or regions of invalidity. At the user level, the details of the data model and its interface are hidden. An important consequence of this approach is that operations of the various modules are polymorphic and interoperable and appear typeless to the user.
The software can present and manipulate data by windowing, zoom-pan-scroll, rotations, time-sequencing, averaging, normalization, color control, and statistical functions. Volume rendering of three-dimensional data can be combined in the same image with displays of lines and surfaces.
The package supports a number of realization techniques for generating renderable geometry from data. For scalar data, these include color and opacity mapping for surface and volume rendering, multiple light sources, arbitrary clipping, contours and isosurfaces, histograms, two- or three-dimensional plotting, and surface deformation. For vector data, presentation options include arrow plots, streamlines, and streaklines.
Data Explorer can perform a number of nongraphical tasks including arithmetic, transcendental, and Boolean operations, type conversion, univariate statistics, and image-processing functions such as transformations, filtering, edge detection, convolution, and morphological operations. The program also provides field/vector operations such as divergence, gradient, and curl, dot, and cross products.
Depending on the analysis requirements, nongridded or scattered data can be interpolated to an arbitrary grid or triangulated. The length, area, or volume of various geometries can also be computed. Tools for data manipulation such as removal of data points, subsetting by position, sub/supersampling, grid construction, mapping, interpolation, regridding, and transposition are available.
Recent enhancements to Data Explorer, including on-line tutorials, make the software easier to learn and use. World Wide Web access to information about DX is available via http://www.ibm.com/DXHome.html, http://www.tc.cornell.edu/Visualization/vis.html, or http://www.tc.cornell.edu/DX/dx.html.
The Minnesota Guidestar project
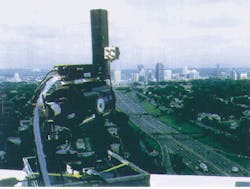
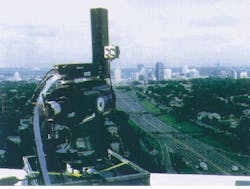
In the Guidestar study, a miniature lidar system operates in conjunction with a network of particulate, carbon monoxide, and traffic-volume sensors to evaluate the impact of traffic congestion on air quality (see Fig. 1). Changes occurring as a result of applying traffic-management methods can be quantified.
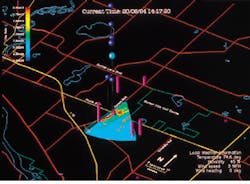
The test sites consist of four areas overlooking access routes to and from a local sports stadium, a golf course, a major shopping mall, and the state fairgrounds. Tests were conducted before, during, and after major events at these venues. By running Data Explorer on an IBM RISC System/6000 workstation, researchers are able to integrate data from all of the instruments and display it as three-dimensional color images superimposed on a geographic information systems map of the test areas (see Fig. 2).
In response to the federal Clean Air Act and the Intermodal Surface Transportation Efficiency Act, state and federal governments must develop surface transportation plans that contribute to the improvement of air quality. The ability of Data Explorer to integrate data from a number of sources and display it in a manner understandable by a nontechnical user is a critical part of this effort. The ultimate goal is to connect all of the instruments and display the data in real time so that the operator can make effective, timely traffic-control decisions. The result will be safer highways, with less congestion and less pollution.
The Minnesota Guidestar program is a joint venture involving the Minnesota Department of Transportation/Minnesota Guidestar (St. Paul, MN), the Federal Highway Administration, IBM (Hawthorne, NY), Los Alamos National Laboratory (Los Alamos, NM), Santa Fe Technologies (Albuquerque, NM), and the University of Minnesota Center for Transportation Studies (Minneapolis, MN). n
FIGURE 1. Miniature lidar system overlooks Interstate 94 scanning toward St. Paul, MN. It has a range of 7 to 10 km and can detect minute differences in the aerosol concentrations over large areas. In addition to the lidar system, a large number of conventional aerosol sensors, carbon monoxide sensors, and traffic counters are deployed.
FIGURE 2. Two-dimensional lidar scan in the vertical direction is overlaid on a geographic information system ma¥of the area near the Bunker Hills Golf Course. The colored balls and hexagons are the locations of carbon monoxide sensors and traffic counters. The size of the icon is proportional to the amount of carbon monoxide or traffic at this particular time.
WILLIAM EICHINGER is a staff member at Los Alamos National Laboratory, EES-5, M/S C300, Los Alamos, NM 87545. RICH SEFECKA is a marketing, programs, and applications specialist and NANCY COLLINS is a senior programmer with IBM Watson Research Center, 30 Saw Mill River Road, Hawthorne, NY 10532. HOWARD KRAYE is the CEO of Santa Fe Technologies, 2021 Girard St. SE, Albuquerque, NM 87106.


