Engineering preview may be worth a thousand words
Marie Côté
Optical designers use a wide variety of technical design and analysis tools for evaluating system performance. And in many cases, performance evaluations are based solely on technical specifications. Theoretically, if the quantitative technical requirements are properly derived from the qualitative performance requirements and are properly designed into the system, the system should produce "good pictures."
Yet pictures have been described as being "worth a thousand words" because the qualitative performance requirements are actually based on intangible factors such as "emotional" expression. For instance, the technical information in a "good picture" may be expressed in the pictorial content itself, perhaps in the terrain of an aerial photograph, or it may be expressed more subtly in the overall quality of the picture, such as the resolution or clarity of the terrain.
Optical systems are designed to produce such pictures routinely, but pictures are rarely used during the engineering phase to evaluate the performance of an optical system that is still being designed. After all, how can you photograph something with an optical system that does not yet exist? Computer simulations have begun to make that possible. And the ability to preview how a particular optical design will express "emotional content" is helping to make engineering decisions, while also helping nontechnical personnel make better-informed decisions during the engineering phase about product performance, trade-offs, costs, and development.
Design visualization basics
Optical designers evaluate imaging and nonimaging system performance with optical design and analysis software using geometric ray tracing. The software's imaging capabilities automatically compute geometric spot diagrams, transverse ray and wave-aberration plots, field curvature and distortion plots, point-spread functions (PSFs), and modulation transfer functions (MTFs). The MTFs are Fourier transforms of the PSFs and are an important measure of a system's image performance, because they plot the system contrast ratio as a function of the object spatial frequency. The software's nonimaging capability automatically computes the illumination system performance, for example, object illuminance from a condenser illumination system. More-advanced software will allow computation of the actual object radiance.
Both sets of tools quickly, but separately, provide experienced designers with important information about system performance. Moreover, these tools are increasingly enhanced with improvements in computer technology and even further when combined with optimization routines to better improve system performance. But nagging questions, and perhaps doubt, still remain: how will the system actually perform, and, ultimately, what will an image really look like?
One way to visualize the performance of the optical system is to compute a system PSF and then to mathematically convolve this function with a scene. Equivalently, you can Fourier-transform the PSF from the optical system to generate the MTF. The inverse Fourier transform of the multiplication of the MTF with the Fourier transform of the scene yields a simple representation of the system performance. Although this technique includes the effect of diffraction, the PSF of an optical system changes depending upon the aperture size and field (object) angle or position. The scene simulation must then be broken into discrete areas containing different calculations to accommodate the changing PSF as a function of aperture and field angle.
Previewing optimal designs
Geometric ray-tracing software also has been developed that incorporates visualization techniques. Such software enables representation of two-dimensional scenes as a series of geometrical rays. These geometrical rays can then be traced through an optical system to the image plane. As the rays propagate through the optical system, they acquire the aberration and power loss imparted to it from the optical system as a function of field angle and pupil position. In a sense, the rays individually and quantitatively sample system performance while their contributions as a whole become a qualitative visualization of the system's image quality.
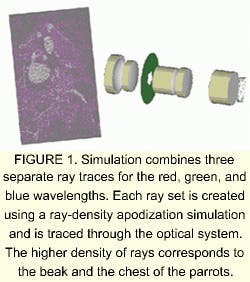
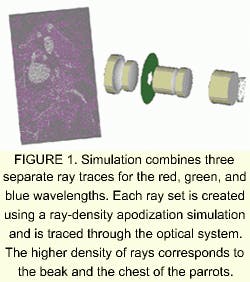
The technique used by the Advanced Systems Analysis Program at Breault Research Organization (Tucson, AZ) involves converting a two-dimensional scene bitmap into constituent red, green, and blue (RGB) components. Each component is then converted into a two-dimensional ray set. The rays in each pixel are assigned the same flux (power), and that pixel's power contribution to the entire scene is adjusted by controlling the number of rays in the pixel. The irradiance of the entire bitmap is used as a probability density function to set the total number of rays per pixel.
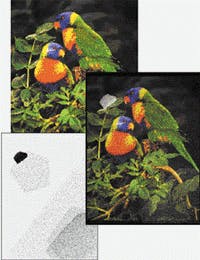
This ray-density apodization approach, as opposed to flux-weighted apodization, is ideally suited for Monte Carlo ray-trace simulations. Each RGB component's set of rays is traced through the optical system, resulting in a composite image at the image plane (see Fig. 1). The RGB image is then converted back into a bitmap, which represents the performance visualization (see Fig. 2).
FIGURE 2. Simulations can be used to visualize all types of system-performance issues, such as tolerance, sensitivity, and ghost effects. For instance, a trained optical engineer may recognize the "ghost" ring about two orders of magnitude down from the peak of the on-axis PSF in an uncoated imaging optical system. But the customer or project manager may need to see the ghost images from a single-layer AR coating to participate in an informed decision about using a higher-performance and more-expensive coating. Top image shows the performance of an ideal system that has perfect AR coatings on all elements. Ghost images (lower left) result from a system that has a single-layer AR coating. Image at right shows the performance degradation.
Well-designed optical systems will produce good images, and poorly designed optical systems, or those that are not performing correctly, will produce poor images. The quantitative tools described could be used to numerically predict these performances, including the effects of ghost images on the PSF of an optical system. People who are not trained optical engineers, however, may have problems "reading" the data and certainly "picturing" the effects on the final image. Therefore, an optical engineer might have trouble convincing a budget-minded project manager or customer that an optical system requires at least a simple quarter-wave antireflection (AR) coating, and more likely a multilayered AR coatingat an increased costto prevent more serious ghosting from, for example, the sun. A picture that is "worth a thousand words" may provide the most straightforward proof that the requested coating is not just simply a matter of overdesigning the system.
MARIE CÔTÉ is an optical engineer at Breault Research Organization, 6400 East Grant Road, Suite 350, Tucson, AZ 85715; e-mail: [email protected].


