Tailoring Laser Peak Power at the Sample to Optimize Multiphoton Microscopy Images
Multiphoton Excitation (MPE) microscopy has brought femtosecond lasers into biological research labs for over 20 years now. Required wavelength ranges for excitation of various probes and laser average power levels compatible with low damage in vivo imaging have been well established. However, the appropriate pulse width (pulse duration) at the sample is still the subject of discussion, individual preference and different experimental methods/conditions. This white paper discusses how pulse energy and pulse width in turn determine peak power. It describes how peak power determines image brightness, how it impacts sample damage and how the user can manipulate the peak power.
Since multiphoton microscopy involves the simultaneous interaction with two or more photons, the efficiency of the various multiphoton effects used for imaging (two-photon excitation, three-photon excitation, CARS, SRS, SHG, THG) has a very non-linear dependence on peak power. So as a general rule, brighter images are obtained by using shorter pulse widths in order to maximize the peak power for a given average laser power.
But the probability of sample damage also depends on the pulse energy, the peak power and the pulse repetition rate. For instance, thermal damage is due mainly to absorption of the laser light by water and increases linearly with average power. However, photobleaching may exhibit a more complex dependence on laser parameters..
This whitepaper discusses the interplay of these factors and explains how the laser user can manipulate the pulse width at the sample by understanding and optimizing the Group Dispersion Delay (GDD) caused by transmissive optics. We show how positive GDD – responsible for pulse stretching – can be offset by the careful use of precompensation modules. And in a new video you can see how the latest TPC option on our Discovery laser now means users can also manipulate the beam power at sub-microsecond speed for the ultimate optimized images.
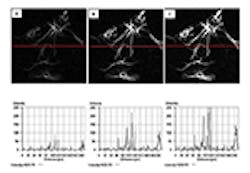
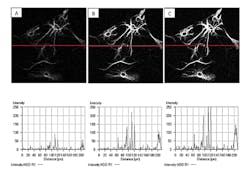
Figure 1. Example of increased image brightness through dispersion compensation. Laser power and detection gain are kept constant but GDD setting are varied for A: 0 fs2, B:10000 fs2 and C: 15000 fs2. 840 nm imaging of CY3 labelled Glial cells courtesy of Grenoble Institute of Neuroscience.
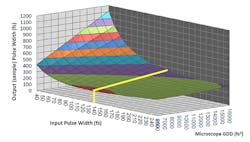
Figure 2. Pulse broadening for different input pulse durations and microscope complexities. This demonstrates
how a laser output pulse width of ~140 fs delivers the shortest pulse width at the sample,
under the widest range of commonly encountered GDD conditions.


