In product development, it’s often difficult to communicate critical information across different roles and teams. Mistakes are made when incomplete design information is shared among team members. An effective approach to combating this challenge in any cross-functional team is providing greater data visualization.
Why data visualization matters in optical design
Often, companies have siloed engineering teams. Optical engineers design optics in their own design software. Mechanical engineers design the components that house the optics in a separate CAD platform. This siloed design approach can slow things down and contribute to miscommunication.
Software that speaks the same language and offers data visualization can help engineers overcome miscommunication and other factors that can thwart the product development process.
Picture the difference in absorbing and understanding figures in a vast Excel spreadsheet versus absorbing and understanding the same information when those figures have been summarized in a visual chart.
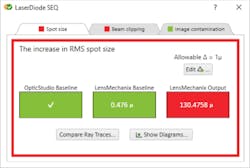
The same concept applies to the optical product design process. Identifying mechanical errors—such as stray light, image contamination, or beam clipping—in a visible dashboard helps mechanical engineers resolve them more quickly. It removes the need for meetings and more meetings with optical engineers. It shortens development cycles and helps teams work more efficiently.
The Optical Performance Summary (OPS) is one of the most powerful analysis tools in LensMechanix to help you detect design issues that affect optical performance.
Data visualization for developing AR/VR products
Recent headlines tout the promise of augmented reality (AR) and virtual reality (VR) for creating data visualization tools, but to get there, we must take a few steps back and apply data visualization to the creation of the AR/VR optical systems themselves. The design process for AR/VR optical systems is a great example of when visible information flows are especially useful, because while freeform optical design can help meet the need for smaller, lighter mechanical packaging, freeform optics present unique design challenges. For example, because in AR systems the projected image and the real-world image must be crisp and undistorted, optical design software packages must allow the designer to simultaneously evaluate the system performance for both paths and to consider both paths during an optimization. Another difficult problem involves minimizing stray light in AR headsets so that the user doesn’t experience eye fatigue. Evaluating system performance on projected and real-world images, and visualizing problematic “hotspots” due to stray light are two areas where data visualization can be incredibly beneficial.
A detector in OpticStudio showing stray light that could reach the eye in an AR prism design.
Greater data visualization with Zemax Virtual Prototyping
Zemax Virtual Prototyping harnesses the power of OpticStudio and LensMechanix software, which allows mechanical engineers to load optical systems designed in OpticStudio directly into their CAD platform to identify the impact of their mechanical design on optical performance. Optical and mechanical engineers are able to work on the same design in their preferred environments and see the impact of each other’s work directly with data visualization—and catch errors early in product development—because they are working on the same virtual prototype.
New eGuide: Six best practices for optical product design teams
In their groundbreaking study, Six Myths of Product Development, Stefan Thomke and Donald Reinertsen exposed common fallacies of product development and presented best practices for overcoming them (Harvard Business Review, May 2012). This eGuide highlights how Zemax Virtual Prototyping applies six of these best practices—including the need for data visualization in optical product design—and what it means for the optical products you create.


