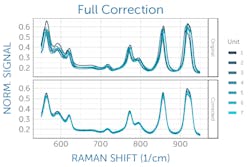
Getting a good fingerprint via Raman spectra
Raman spectroscopy, widely used as a nondestructive chemical fingerprinting technique for sample identification and analysis, depends on the acquisition of accurate, reproducible spectra.
The applications of portable Raman spectroscopy are rapidly increasing, due largely to the availability of compact, portable instruments, more sophisticated data analysis, and greater understanding of this powerful technique within the scientific community. Raman has revolutionized quality control in pharma, improved security for first responders, and is poised to have a similar impact on healthcare, food, and many other areas.
Raman’s ability to provide a rapid chemical fingerprint without contacting or consuming the sample makes it ideal for use in point-of-care and mobile settings, and its capacity for extracting meaningful results from complex samples is generating excitement in many nontraditional fields.
Likewise, the analysis of Raman spectra has evolved beyond traditional library matching techniques to include classification methods and AI methods such as neural networks. These techniques provide more sophisticated analyses of complex samples like biological materials, working more akin to ‘facial recognition’ than ‘fingerprint matching’ to discriminate between healthy and diseased tissue, or for the detection of tampered with or fraudulent foods.
Good data in = Good answers out
Getting dependable, actionable answers from any Raman analysis method requires reproducible Raman spectra, both from one instrument to the next, and under the varying conditions of day-to-day use. This minimizes the variability in the large quantities of data collected and used to build and apply these models. It allows discrimination between subtler differences in sample spectra, while also improving confidence in their output—regardless of when or where the measurement occurs.
So how can you ensure consistent spectra are collected when each Raman spectrometer is individually aligned and optimized, and on any given day? With many optical, mechanical, and electronic parts in every unit, there will always be some unavoidable differences in spectra, even for the same instrument built in volumes of 10, 100, or 100,000—no matter how exacting the quality control or how carefully aligned.
Fortunately, a good optical design can eliminate a considerable amount of variability. Raman spectrometers designed with transmission-based optics are preferred by many instrument developers, due to the ease of correcting for higher-order optical aberrations, greater thermal stability, and reduced alignment sensitivity (as compared to the asymmetric, folded optical path and reflective mirrors and replicated gratings used in compact, crossed Czerny-Turner spectrometers).
Even with the best possible optical design and good manufacturing practices, some unit-to-unit differences will remain, arising from native variations in the sensor and grating efficiency, as well as other accumulated manufacturing tolerances. But a few simple calibration measurements and corrections can significantly reduce variability—both between spectrometers and because of daily environmental changes.1 Careful pre-processing of your instrument’s raw data to ensure a given sample looks the same on all units is an important precursor to post-processing steps like baseline correction and spectral deconvolution used to further clean up Raman spectra prior to applying library matching or models.
The X-factor: Wavelength and wavenumber correction
The first and most important step is getting the x-axis right. In Raman spectroscopy, it’s reported in wavenumbers (cm-1). In Raman, a laser is used to excite the sample, generating a tiny fraction of scattered light that is shifted in wavelength by the amount of energy needed to excite a vibrational and/or rotational transition in the molecule. Each Raman scattered peak corresponds to a chemical bond or group, which together build up a unique fingerprint of the chemical identity of the sample.
Since we are interested in the shift of the Raman scattered light frequency relative to the laser excitation (λex), we must convert both wavelengths into wavenumbers using ṽ = 1/λ and take the difference, yielding an x-axis that reports Raman shift in cm-1.
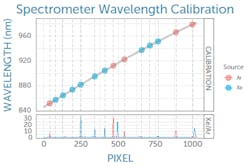
In practice, this begins with calibrating the spectrometer in wavelength, which is typically done by the Raman spectrometer manufacturer. By looking at a series of reference atomic emission lines, a polynomial fit can be generated to correlate pixel number on the spectrometer detector to wavelength (see Fig. 1), a calibration that is applied in software.This wavelength calibration is then used to determine the Raman shift of the recorded spectrum in wavenumbers (cm-1) relative to the excitation laser wavelength—but with caution. Like any other component, a Raman laser’s emission wavelength is subject to manufacturing variability. Though typically within ±0.5 nm, this translates to a Raman shift of about 8 cm-1 at a Raman excitation wavelength of 785 nm, enough to be of concern.
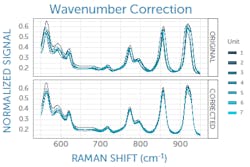
The exact laser wavelength can be determined using measurements of an ASTM Raman reference standard such as polystyrene, for which the peak positions are known to within 1 cm-1.2 Taking the average difference between the measured and known peak positions of the reference standard reveals the deviation of the laser from its nominal wavelength to allow correction (see Fig. 2). If the laser is integrated with the Raman spectrometer in a system, the laser wavelength correction can be determined at the manufacturer and applied in software; otherwise, it must be performed by the user.It is also highly advisable to perform a daily wavenumber correction analogous to the laser correction above using an ASTM reference standard, as this has been shown necessary to achieve successful transfer of Raman spectral libraries across various commercial instruments.3 This final correction to the wavenumber axis captures any minor day-to-day changes in the laser wavelength, spectrometer wavelength calibration, or other minor shifts of the spectrum—for example, due to external temperature changes. It must be performed on site daily by the user.
Y: Relative intensity is important
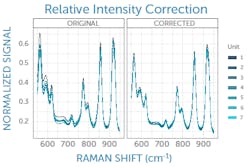
Once Raman peak positions are accurate, relative peak heights must be corrected. Peak height ratios are an important factor in library matching and other spectral analysis algorithms, and even more so for quantitative Raman measurements. Each Raman spectrometer design has its own unique spectral response composed of the many response functions and efficiencies of its individual components. Unit-to-unit differences in components and the minutiae of how they are aligned adds further variability that must be addressed.
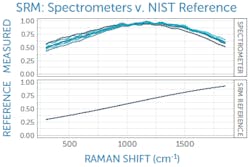
This can be corrected with a relative intensity calibration, obtained using a different standard reference material (SRM), which emits a broadband fluorescence spectrum of a well-known shape when used in a Raman system (see Fig. 3).4 Raman SRM materials are typically a solid block of glass of well-known composition, making them much simpler to use than the radiometric calibration lamps or gold standards used in UV/VIS/NIR spectroscopy.If the Raman spectrometer design is sound and all x- and y-axis corrections have been applied, it is possible to achieve better than 99% agreement in Raman spectra between units as measured with pairwise correlation.5 Since each spectrometer will naturally have a slightly different relationship between pixel position and Raman shift, interpolating between pixels to yield a common wavenumber axis makes this comparison much easier and simplifies further analysis. This sets the stage for the next phases of Raman data processing, from baseline subtraction and deconvolution to library matching or model development, and it ensures all post-processing and analysis can proceed with high confidence in the integrity of the raw data being used.
Rock-solid Raman spectra
Modern Raman applications require a high degree of unit-to-unit agreement between individual spectrometers to deliver consistent, dependable answers in the field. Due to their complex optics, however, even identically designed, configured, and calibrated spectrometers experience some variation in their spectra. This can easily and effectively be corrected through a combination of carefully applied wavelength, wavenumber, and intensity corrections to standardize the response of all units prior to further processing and application-specific analysis of the spectra. This straightforward correction process makes it possible to use common matching libraries or universal chemometric models for entire series of spectrometers with high accuracy.
REFERENCES
1. European Pharmacopeia 8.7 Edition 2016, Chapter 2.2.48, European Directorate for the Quality of Medicines & Healthcare (2016).
2. ASTM E1840-96(2014), Standard Guide for Raman Shift Standards for Spectrometer Calibration, ASTM International, West Conshohocken, PA (2014).
3. J. D. Rodriguez, B. J. Westenberger, L. F. Buhse, and J. F. Kauffman, Analyst, 136, 20, 4232–4240 (2011).
4. ASTM E1840-96(2014), Standard Guide for Raman Shift Standards for Spectrometer Calibration, ASTM International, West Conshohocken, PA (2014).
5. See https://wasatchphotonics.com/technologies/reproducible-raman-measurements.
Cicely Rathmell | Vice President of Marketing, Wasatch Photonics
Cicely Rathmell, MSc, is vice president of marketing at Wasatch Photonics, and based in Dunedin, FL.
Dieter Bingemann | Senior Applications Scientist, Wasatch Photonics
Dieter Bingemann, Ph.D., is senior applications scientist at Wasatch Photonics, based in Wiesbaden, Germany.
