Gamut Rings are the future for display color evaluation
A key performance factor of an electronic display is the range of colors it can reproduce, and laser displays are pushing the limits of what is possible in terms of color reproduction. But we still assess and communicate the color capability of displays in a way that is a relic from the days of the CRT and no longer valid—which makes fair comparisons impossible and hides outstanding performance amongst the mediocre.
The sensation of color has three dimensions and can be expressed in various ways. For example, amounts of red, green, and blue, or degrees of hue, saturation, and lightness, but in each case three quantities are required.
The main standards bodies such as the International Commission on Illumination (CIE), International Electrotechnical Commission (IEC), and others agree that perceived color should be assessed within a three-dimensional (3D) color space, specifically the CIE 1976 L*a*b* color space, or CIELab for short. The volume in CIELab space occupied by the range of colors reproducible by a display is known as the color gamut volume (CGV).
CIELab is a color space where a given point within that space represents the perception of a color, mapped in terms of L* (lightness), a* (red-green color difference), and b* (yellow-blue color difference). It was chosen to characterize color capability because a numerical distance within CIELab space, from any position and in any direction, roughly corresponds to an equal degree of perceptual color difference. This implies that a given numerical volume in CIELab space expresses the same color capability regardless of where that volume is located and, therefore, the total CGV enclosing all color reproducible by a display is a good metric for overall color capability.
Despite the broad consensus on the use of CIELab, we are used to expressing electronic display color capability as a triangular area within a two-dimensional (2D) chromaticity plot.
Chromaticity is an expression of color independent of luminance, and was developed to characterize the color of light sources. A chromaticity is an expression of hue and of saturation, where a plot shows the full range of possible values, with grays in the middle bounded by the chromaticities of monochromatic sources (known as the spectral locus) around the edge.
The range of chromaticities that could be produced by a display lie within a triangle formed between red, green, and blue primaries, and the area of this triangle is known as the chromaticity area (CA). But, for a display, the perceived lightness of a color matters—yellow and brown are distinct colors, and yet they can have identical chromaticity. So, why are we using the wrong metric?
One reason is convenience—a complex hull within a 3D space is hard to communicate accurately within 2D media (print or screen), especially compared to a simple triangle plotted in a chromaticity space. The main reason is inertia. It turns out that CA correlates well with CGV when color is produced only by adding quantities of red, green, and blue—which is exactly how CRTs worked. Modern flat-panel and projection displays broke that paradigm long ago, but we were so used to expressing color using chromaticity by that point, so we just carried on.
What broke the use of chromaticity?
The most significant change was to use more than just RGB to produce a color, adding quantities of colors such as white, yellow, or cyan through additional subpixels or drive phases. This was and is done for good reasons, such as improving efficiency, luminance, or pushing color performance in other ways. But it also breaks the one-to-one relationship between a color specified as quantities of red, green, and blue and how that color is reproduced—and invalidates the assumptions behind the use of chromaticity.
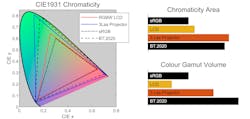
Figure 1 demonstrates this issue, with the chromaticity plot on the left showing two sets of display measurements (based on data courtesy of Karl Lang of Lumita Inc., and Dr. Johan Bergquist) and the two reference color spaces they target. The measured displays are an RGBW liquid crystal display (LCD) and a tri-laser projector, and the target color spaces are sRGB, the typical computer graphics color standard, and BT.2020, used for wide color gamut image data. This plot suggests good performance from both displays, in each case the CA exceeds that of the target color space.
The bar chart shows the relative CA and CGV for each of the gamuts. The CGV of the reference color spaces are what would be achieved assuming an ideal additive display, and so are what the CA implies color performance is likely to be. The LCD has only half the real color capability suggested by the chromaticity plot. The laser projector is also slightly down on the reference standard; however, it shows almost three times the color capability of the flat panel, a performance difference that is just not apparent from the CA values.
Chromaticity overrepresents the performance of many displays (by up to a factor of 4; see first reference in Further Reading) and we should directly assess gamut volume in CIELab. But as a 3D space, it is still hard to communicate. To address this issue, a new visualization of CIELab color performance has been developed, called the Gamut Ring plot.
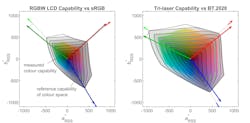
The Gamut Ring plot is, in essence, a 2D transform of the 3D CIELab color space. A given color gamut in CIELab space is sliced up in steps of 10 L*. These slices are flattened, in a way that preserves the hue angle and makes the 2D area numerically equal to the 3D CIELab volume.
Starting from the lowest lightness slice, each subsequent slice is stretched around the previous one to produce a set of “gamut rings.” Rings are generally shown colored to indicate the hue angles represented. The axes of the gamut ring plot are labeled a*rss and b*rss and are a transform of the CIELab a* and b* units such that an area in a ring plot has units of CIELab volume.
Most relevant for a display targeting a particular color standard (which all do) is a variant called the “Gamut Ring Intersection” (GRI) plot, which overlays the capability of a display over that of the reference display with the reference color space shown in gray. Additional information is also typically shown, such as the hue angles of the display primaries compared to that of the reference standard.
Figure 2 shows the GRI plots for the LCD and tri-laser displays. The total CGV from the Fig. 1 bar chart is also shown in the GRI plot as the total areas of the colored rings. A GRI plot also shows where the capability of the test displays lies. In this case, the RGBW LCD is lacking color capability at higher lightness (the outer rings show uncovered gray), so any bright colorful features in displayed images are likely to appear dim or washed out.
The tri-laser also lacks performance at high lightness, but to a much lesser degree than the flat-panel display. Its overall color performance is immediately apparent with the GRI plot, as well as its performance compared to the target standard—which it resolves via hue, lightness, and saturation.
Metrology is not always the most exciting of subjects, but what we measure and communicate directly impacts the decisions we make in selecting and developing technologies. The use of chromaticity is a relic of CRT days and does not provide a fair metric of color performance. Gamut Ring plots transform the hard-to-use CIELab plots into an expressive, informative and, above all, quantitative form that should be used instead.
Standards describing the Gamut Ring plot have been published by the IEC (iec.ch) and International Committee for Display Metrology (ICDM; www.sid.org/standards/ICDM), and the first standards for Gamut Ring Intersection are being prepared by the IEC initially for laser displays. It’s expected to be adopted more widely for all display types.
FURTHER READING
E. Smith, R. L. Heckaman, K. Lang, J. Penczek, and J. Bergquist, JSID, 28, 548–556 (2020).
Standards, for example: IEC 62341-6-1, or the IDMS v1.2 (from www.sid.org/standards/ICDM).
About the Author
Euan Smith
Euan Smith is head of systems and photonics at 42 Technology, a product design and innovation consultancy based near Cambridge, U.K.


