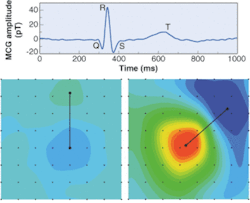
In an electrocardiogram, electrodes attached to the body sense voltages that mirror electric currents connected with heart-muscle activity. With the advent of superconducting quantum-interference-device (SQUID) magnetometers, it has become possible to map the magnetic field accompanying these currents from outside the body, a procedure called magnetocardiography. Whether diagnostics based on magnetic-field measurements are superior to the conclusions electrocardiograms allow is still under discussion. There is evidence that such is the case, but not enough is known about the heart's magnetic field.1 One reason for this lack of data is the low number of SQUID systems in use to date, largely a result of their high cost.
This situation may change with the introduction of an optical magnetometer demonstrated at the Universität Freiburg/Fribourg (Fribourg, Switzerland).2, 3 Although not as sensitive as a SQUID magnetometer system, the instrument nonetheless shows comparable results, along with a price tag potentially a tenth that of a SQUID. As a result, investigations of the heart's magnetic field could become more common.
Optical magnetometers for the measurement of weak magnetic fields are well-known. They exploit level-splitting of alkali atoms in a magnetic field using optical pumping of the sample and radio-frequency sensing of the level-splitting. The detection is performed optically by monitoring the absorption of the sample. This technique can be adapted to measure the heart's magnetic field (see Fig. 1).
An optical magnetometer measured a magnetic transient from the chest of a human subject that showed a maximum field strength of about 40 pT (top). The features Q, R, S, and T correspond to different activation phases during a heartbeat and are known from electrocardiogram and SQUID measurements. Scanning the optical magnetometer over an 8 × 8 grid across the subject's chest produced an array of data on the heart's magnetic field. Using standard evaluation software that interpolates between the results of measurement at discrete locations, a contour plot was produced (bottom). It is a "snapshot" of a movie that displays the temporal rise and fall of the heart's magnetic field and its spatial structure during a heartbeat (the movie can be seen at Reference 3; www.opticsexpress.org).
In the setup, the light from a semiconductor laser is actively frequency locked to the F = 4 hyperfine line of the cesium (Cs) D1 transition (894 nm) using a Cs vapor cell 20 mm long and 20 mm in diameter. The laser radiation is then coupled into an optical fiber, circularly polarized, and fed to the Cs sensor cell to spin-polarize Cs atoms. The transmitted laser power is monitored by a photodiode.
The spins precess at the so-called Larmor frequency around a weak bias magnetic field B0 of 5 µT (about a tenth of Earth's magnetic field) that is oriented at 45° with respect to the laser beam. Application of a radio-frequency magnetic field B1 at the Larmor frequency synchronizes the precession phases of the atomic spins so that a net polarization is obtained, which oscillates with the Larmor frequency and modulates the transmission of the laser beam through the cell. Thus, the modulated part of the transmission signal can be recorded by a phase-sensitive lock-in amplifier that receives its reference from the B1 field generator.
Gradiometer suppresses noise
A superposition of a heart-induced magnetic-field component shifts the Larmor frequency and can be detected as a mismatch between the Larmor frequency and the frequency of the B1 field. Because this may happen with any other field fluctuation disturbing the measurement, not only is magnetic shielding necessary but a gradiometer that is sensitive to the magnetic field gradient only must also be set up .
For this purpose, the laser beam is split into two beams, each passing through a separate Cs vapor cell and exposed to the same B0 and B1 fields. One cell is mounted 7 cm away from the body to sense background noise, while the other is placed close to the chest to sense both the heart's magnetic field and the background. The background field is thus subtracted out. One of the researchers was scanned with the optical magnetometer, resulting in a movie of the resulting magnetic field (see figure).
The Fribourg researchers plan to use a second-order gradiometer consisting of three sensor cells to improve the background field suppression. They expect that this will eliminate the need for magnetic shielding and thus make the device suitable for general use in a standard hospital environment.
REFERENCES
- I. Tavarozzi et al., Ital. Heart J. 3, 151 (2002).
- G. Bison et al., Appl. Phys. B 76, 325 (2003).
- G. Bison et al., Optics Express 11(8) 904 (2003).
