TOSHIHIRO ISHII, TAKEAKI SHIMOKAWA, YOICHIRO TAKAHASHI, and OKITO YAMASHITA
Vertical-cavity surface-emitting lasers (VCSELs) are laser diodes that emit perpendicular to the surface of the wafer they are fabricated on, and thus do not require cleaving to form their laser cavities. These coherent light sources are now being used for 3D sensing in smartphones and light detection and ranging (lidar)—much active research is aimed at fully exploiting the potential of VCSELs. Here, an example of functional near-infrared spectroscopy (fNIRS) using near-infrared (near-IR) VCSELs to achieve high resolution is introduced.
Application of VCSELs to fNIRS
Functional near-infrared spectroscopy uses near-IR light for noninvasive measurement of the brain’s activation distribution. The technique is widely used as a measurement tool in brain-science research. In Japan, its auxiliary use for diagnosis of depression and preepileptic surgery examination is covered by insurance. fNIRS is also currently being studied for possible use in attention-deficit hyperactivity disorder (ADHD) drug-efficacy judgments and rehabilitation for insurance purposes.1, 2
Functional network analysis is currently attracting attention as a tool for analyzing the network type that each brain region creates and functions, making it possible to diagnose dementia, schizophrenia, and autism, among other afflictions. Functional network analysis is accomplished using functional magnetic-resonance imaging (fMRI). Conventional fNIRS has insufficient spatial resolution accuracy for this purpose—however, its simple measuring apparatus is indispensable for easy measurements involving medical examinations.
Multidirectional DOT
Diffuse optical tomography (DOT) is an advanced version of fNIRS enabling high-precision, 3D functional imaging of the interior of the living body.3 DOT can be extended from detector data arranged in the 2D plane to 3D data by solving defect problems. It requires highly accurate forward and inverse problem analysis. In the former, the amount of light detected is calculated by solving the light propagation model in the living body, whereas in the latter, optical absorber distribution (cerebral blood-flow distribution) is obtained by minimizing the difference between the previous and actual measurement value.
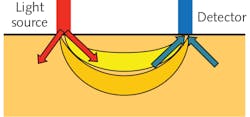
The inverse problem is solved here using a hierarchical Bayesian estimation method.4 However, use of fNIRS measurement with a high-density probe arrangement given a spacing of at most 15 mm is required to obtain the information necessary for 3D reconstruction, making it more complicated and laborious. Therefore, a method has been introduced that can perform simple DOT using a multidirectional light source and multidirectional detector (see Fig. 1), improving the spatial resolution of the activation area of cerebral blood flow by emission of a beam with two wavelengths from one probe in four directions and reception of light in four directions. Additionally, light propagating in different directions with respect to the surface of a living body travels through different paths, increasing the information. A pseudo-high-density probe has been realized assuming that light propagating into the living body has directionality.5
Multidirectional DOT can be realized by conducting high-precision optical simulation, rendering in a way such that the directionality of obliquely incident light is maintained. Generally, light propagation in a tissue body—for example, human skin—is often simulated as a diffusion equation. However, the drawback here is the erasure of the beam’s propagation direction. Alternatively, a method exists that uses Monte Carlo simulation, although not an analytical one.6 There is also a publicly available simulation tool that uses Monte Carlo extreme (MCX)7—this is written in CUDA to use a graphics processing unit and can calculate based on numbers of photons exceeding 109. Here, an optical simulation was conducted using MCX to accurately describe the direction of light propagation.
Optical design of multidirectional module
Four light-transmitting and light-receiving modules were prepared with each module separated by about 30 mm. The light-transmission module was designed to emit near-IR light of two wavelengths and four directions from the same position. Two VCSEL chips with wavelengths of 780 and 905 nm were used as light sources. Each VCSEL chip was about 1 mm square; the four light-emitting points on the chip were arranged in a square with a distance of about 500 μm.
A lens with an effective diameter of about 1 mm and a focal length of 0.1 mm was mounted on the VCSEL chip at a position of about 100 μm away from the chip. A pair of lenses was used for two adjacent VCSELs of two different wavelengths. The light was clearly refracted by the lenses and separated into four directions (see Fig. 2).Subsequently, a resin prism was placed on the lens pair to reflect the beam on each side surface, producing eight light beams gathered at the center of the prism’s upper surface. The 1 mm lens was placed at a position shifted by several micrometers from the center of the VCSEL chip to correct the chip’s relative position.8
Optical mounting
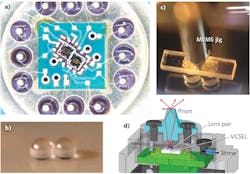
A 10-mm-square printed circuit board (PCB) submount held two 1-mm-square VCSELs, with both electrically connected by wire bonding. The two VCSELs were positioned and fixed in place on the submount to an accuracy of about 1 µm under the microscope. The PCB was mounted on a metal can package with a diameter of about 30 mm (see Fig. 3a). The can was placed on a large PCB to which a microcomputer was also mounted; wire bonding was performed between the VCSEL and submount and between the submount and can package. A pair of lenses was placed and accurately fixed by an ultraviolet (UV) curable resin with an appropriate space between the lenses so that the distance between the lens centers becomes a design value (see Fig. 3b). The lens center was positioned to the design value so that the lens’ outer shape tolerance was unaffected.To realize this high-precision mounting, a microelectromechanical-systems (MEMS) jig was fabricated using photolithography. The jig had a hole with an inclined surface of an inverted pyramidal shape matching a design value. About 50 g of pressure was applied to fit the convex 1 mm lens into its hole; UV curing fixed the lens in place at its correct position (see Fig. 3c). Because mounting of the two VCSEL chips and 1 mm lens also requires highly accurate alignment, an active-alignment procedure was used in which the prism was finely moved as the positions of the eight light beams were checked (see Fig. 3d). The target value was specified such that eight beams must enter within the 1 mm squares on the end face of the prism.
The light-receiving module uses a quad-cell photodiode (PD; 3 mm square) with a 3-mm-diameter lens directly above it to determine the incident direction. Such mounting can align the centers of both the lens and PD with mechanical accuracy under the microscope. Each module was equipped with a PCB (on which we placed a microcomputer and amplifier), and a module about 100 × 10 × 10 mm in size as the outer shape (see Fig. 4).Measurement results
Measurements with a phantom were taken—two corrections performed will be described. First is a system for monitoring the amount of light emitted from the VCSEL. The monitor VCSEL uses the fact that the leaked light from the adjacent VCSEL enters the active layer of the VCSEL, generating an electromotive force (see Fig. 5). The monitor PD can be repositioned in a very small area. Second, mounting was performed by placing eight beams within 1 mm on the prism end face first. Since it was difficult to reach submillimeter positioning, the beam position was measured and corrections were incorporated into the calculation of the forward problem, improving the phantom position estimation error by 30%. Results show that 3D estimation is possible within a position error of 5 mm, even with a low-density measurement with a probe interval of 30 mm (up to a depth of 15 mm).10REFERENCES
1. Y. Monden et al., Neuroimage Clin., 1, 131–140 (2012).
2. M. Mihara et al., Neurophotonics, 3, 031414 (2016).
3. A. T. Eggebrecht et al., Nat. Photonics, 8, 448–454 (2014).
4. T. Shimokawa et al., Opt. Express, 20, 20427–20446 (2012).
5. T. Ishii et al., U.S. Patent No.10039452 (2018).
6. Q. Fang et al., Opt. Express, 17, 20178 (2009).
7. See http://mcx.space.
8. T. Ishii et al., U.S. Patent No.10175169 (2019).
9. T. Ishii et al., U.S. Patent No.10177530 (2019).
10. T. Shimokawa et al., Biomed. Opt. Express, 7, 2623 (2016).
11. T. Shimokawa et al., Biomed. Opt. Express, 10, 1393 (2019).
Toshihiro Ishii and Yoichiro Takahashi are at Ricoh, Tokyo, Japan; Takeaki Shimokawa is at Mitsubishi Electric, Tokyo, Japan; and Okito Yamashita is at the Advanced Telecommunications Research Institute International (ATR), Kyoto, Japan; e-mail: [email protected]; www.ricoh.com, www.mitsubishielectric.com, and www.atr.jp.

![FIGURE 2. A resin prism divides the light from each of two VCSELs placed 1 mm apart into four, resulting in eight beams with differing directions. All beams converge at one point on the surface of the subject, which results from a shift of the positions of VCSELs 1 and 2 from the lens center by several micrometers. [8] FIGURE 2. A resin prism divides the light from each of two VCSELs placed 1 mm apart into four, resulting in eight beams with differing directions. All beams converge at one point on the surface of the subject, which results from a shift of the positions of VCSELs 1 and 2 from the lens center by several micrometers. [8]](https://img.laserfocusworld.com/files/base/ebm/lfw/image/2019/12/1912LFW_ish_f2.5de8142fdb2d6.png?auto=format,compress&fit=max&q=45&w=250&width=250)

![FIGURE 4. A VCSEL with light-intensity monitor is shown. [9] FIGURE 4. A VCSEL with light-intensity monitor is shown. [9]](https://img.laserfocusworld.com/files/base/ebm/lfw/image/2019/12/1912LFW_ish_f4.5de8154e39997.png?auto=format,compress&fit=max&q=45&w=250&width=250)
![FIGURE 5. A multidirectional fNIRS module is shown. [11] FIGURE 5. A multidirectional fNIRS module is shown. [11]](https://img.laserfocusworld.com/files/base/ebm/lfw/image/2019/12/1912LFW_ish_f5.5de8160029cd6.png?auto=format,compress&fit=max&q=45&w=250&width=250)
![FIGURE 6. A fMRI (a) and the time course of each fNIRS module (b). [11] FIGURE 6. A fMRI (a) and the time course of each fNIRS module (b). [11]](https://img.laserfocusworld.com/files/base/ebm/lfw/image/2019/12/1912LFW_ish_f6.5de81650cc70d.png?auto=format,compress&fit=max&q=45&w=250&width=250)
![FIGURE 7. fNIRS results (three-time repeated measurement) are shown. [11] FIGURE 7. fNIRS results (three-time repeated measurement) are shown. [11]](https://img.laserfocusworld.com/files/base/ebm/lfw/image/2019/12/1912LFW_ish_f7.5de816ab975b1.png?auto=format,compress&fit=max&q=45&w=250&width=250)